Actively Managed Equity
 Overview: All Strategies
 Investor Resources
 Indexed Equity
 Private Equity
 Digital Assets
 Invest In The Future Today
 Take Advantage Of Market Inefficiencies
 Make The World A Better Place
 Articles
 Podcasts
 White Papers
 Newsletters
 Videos
 Big Ideas 2024
ARK’s Expected Value For Tesla In 2027: $2,000 Per Share


The information presented reflects the views and assumptions of the authors at the time of publication. Please note that this research is at least one year old and the authors’ current views may materially differ from those presented without notice. The results will not be updated as ARK’s internal models change, or any information upon which ARK relies upon changes.
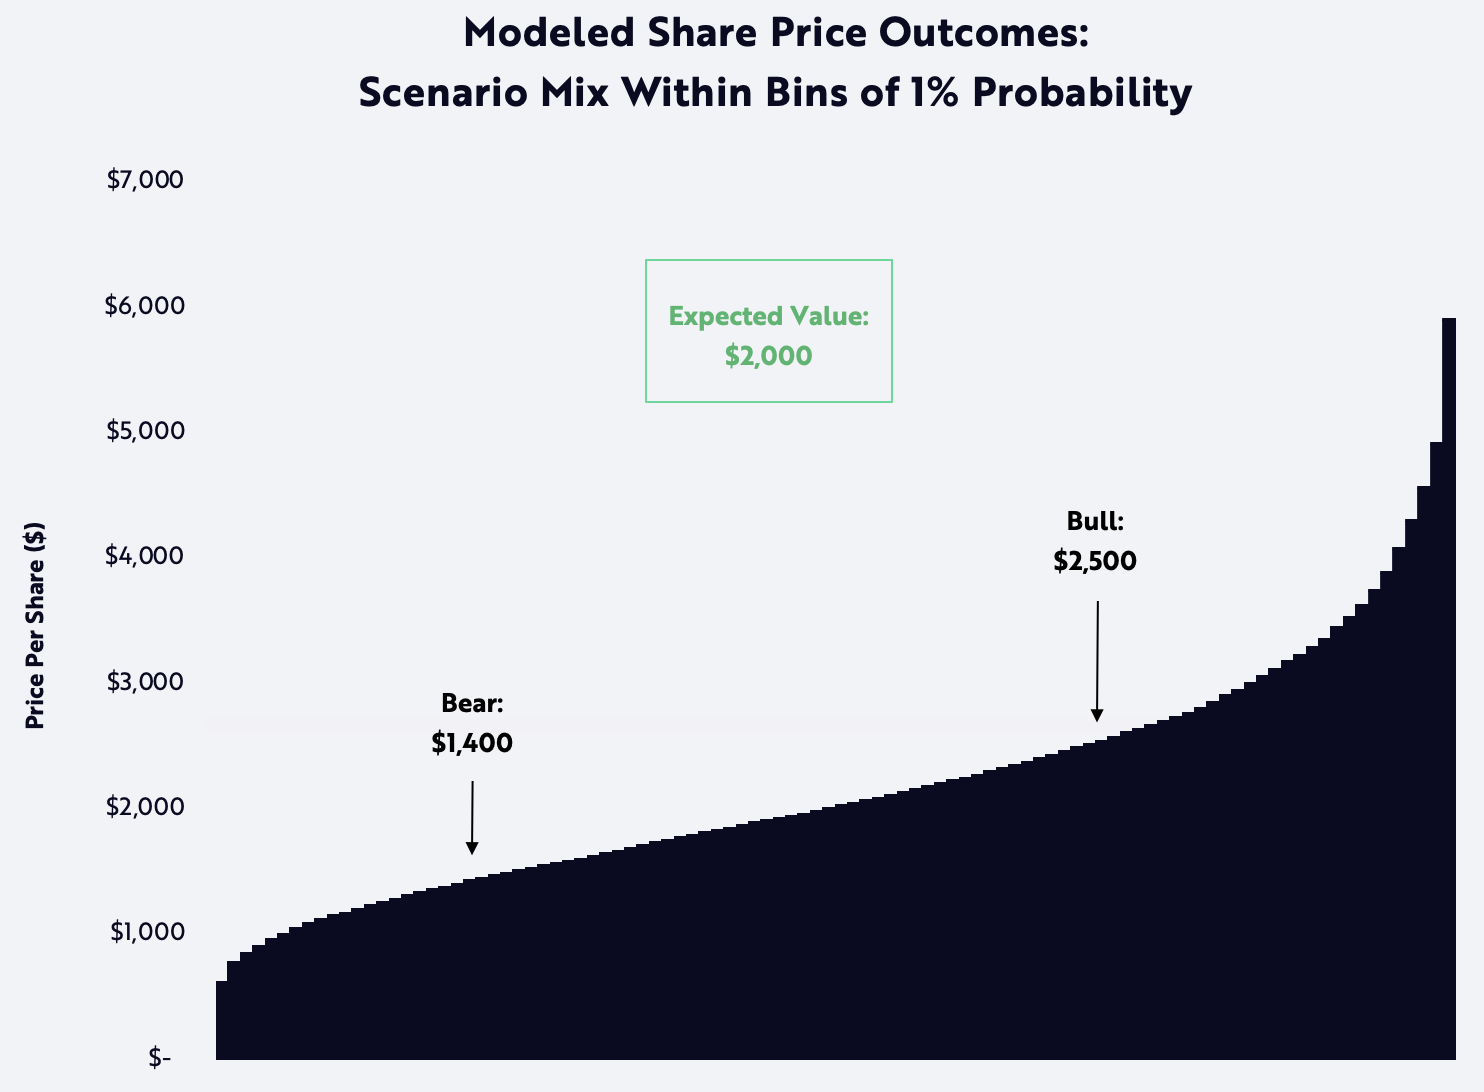
ARK’s updated open-source Tesla model yields an expected value per share of $2,000 in 2027. The bull and bear cases, tuned to the 75th and 25th percentile Monte Carlo outcomes, respectively, are approximately $2,500 and $1,400 per share, as shown below.[1]
| ARK’s Simulation Outputs | ARK’s 2027 Price Estimate (Per Share) | Significance |
|---|---|---|
| Expected Value | $2,000 | ARK’s expected value for Tesla’s stock price in 2027, based on our Monte Carlo analysis. |
| Bear | $1,400 | We model a 25% probability that Tesla could be worth $1,400 per share or less in 2027. |
| Bull | $2,500 | We model a 25% probability that Tesla could be worth $2,500 per share or more in 2027. |
Source: ARK Investment Management LLC, 2023.
Our updated Monte Carlo model moves the prior 2026 target out one year to 2027. For the benefit of readers, this article presents “expected” (or “base”), “bear,” and “bull” cases as a way of contextualizing the meaning of our 2027 share price expectations. Methodologically, we arrive at our base-case share price by averaging one million simulations produced by our Monte Carlo model. Our bear and bull cases are the 25th and 75th percentile values, respectively. Forecasts are inherently limited and cannot be relied upon as a basis for making an investment decision and are built on our modeling that reflects our biases and long term positive view of the company. Please see additional disclosure below on forecasts and hypothetical performance. For informational purposes only and should not be considered investment advice, or a recommendation to buy, sell or hold any particular security.
This research update presents ARK’s new open-source Tesla model, which incorporates distributions for 41 independent inputs to simulate a range of potential outcomes for the company.
Tesla’s prospective robotaxi business line is a key driver, contributing 67% of expected enterprise value and 64% of expected EBITDA in 2027.[2] Across our simulation set, electric vehicles account for 47% of revenues in 2027, at substantially lower margins than robotaxi revenue. The chart below breaks down attributable revenue, EBITDA, and value by business-line.
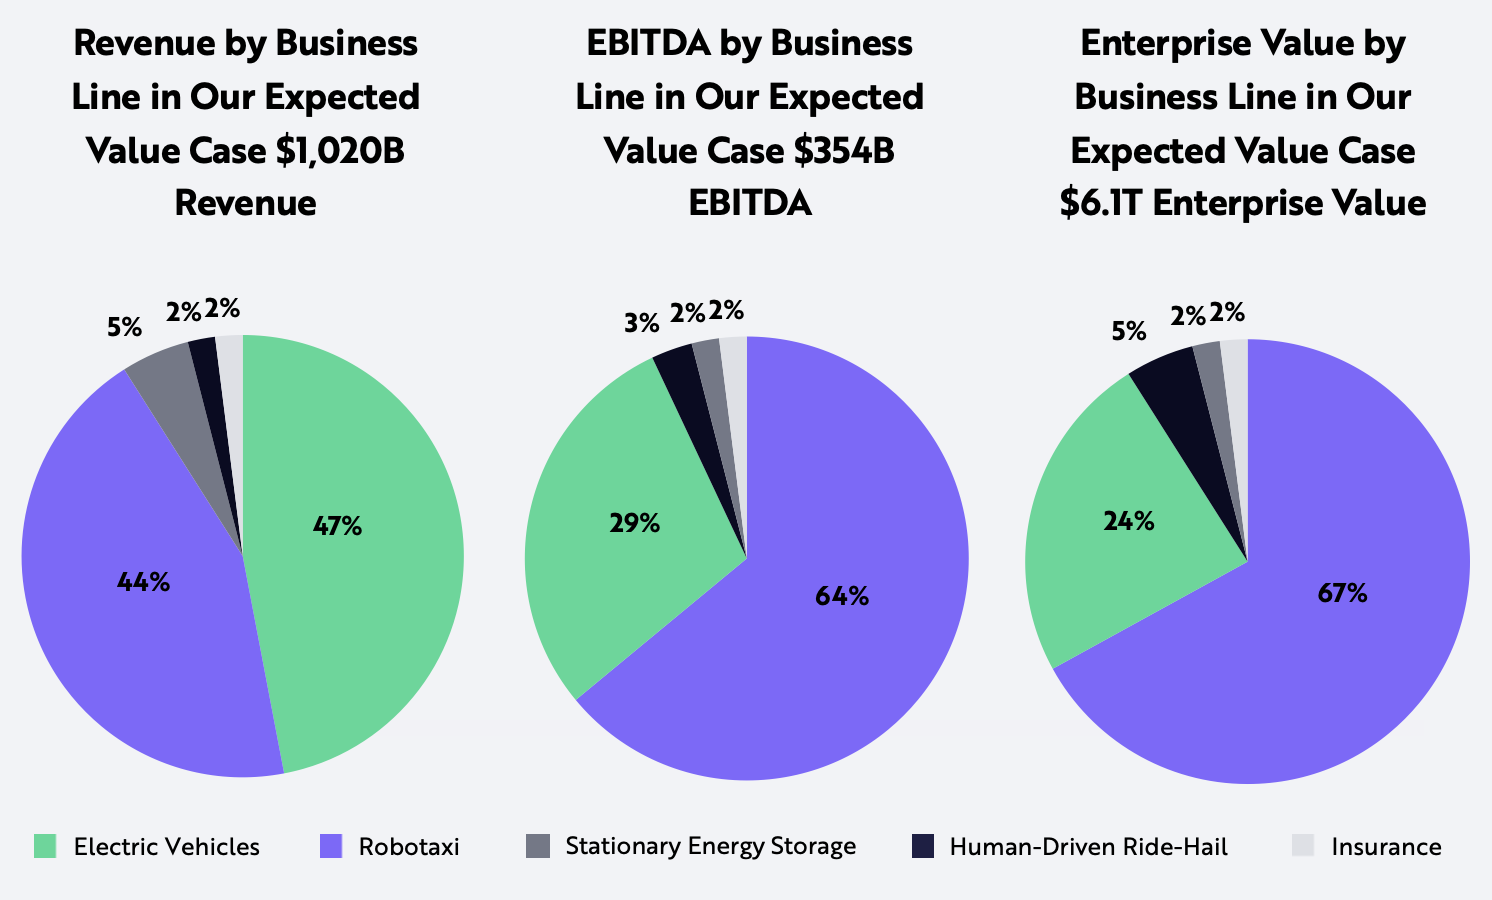
Note: The above charts were updated on 4/21/2023. Previously, the pie charts included 2026 expectations. They have now been updated to 2027. Source: ARK Investment Management LLC, 2023.
Forecasts are inherently limited and cannot be relied upon as a basis for making an investment decision and are built on our modeling that reflects our biases and long term positive view of the company. Please see additional disclosure below on forecasts and hypothetical performance. For informational purposes only and should not be considered investment advice, or a recommendation to buy, sell or hold any particular security.
This article outlines five topics, including the risks and limits associated with our assumptions:
- Example Bear And Bull Outcomes
- Key Model Inputs And Updates To ARK’s 2022 Tesla Model
- 2027 Share Price Forecast
- 2027 Model Considerations That Are Not Key Drivers Of Our Price Estimates
- Risks and Limits Of Our Model
- Business Opportunities Not Included In The Model
Example Bear and Bull Outcomes
We do not provide a single bull or bear case because we dimension the bull and bear outcomes as the 75th and 25th percentile output from the simulation. Nonetheless, the table below presents what we believe are plausible examples for each case.[3]
Example Outputs for Bear and Bull Outcomes
| Example Output* | 2022 Actual | Example Bear Outcome 2027 | Example Bull Outcome 2027 |
|---|---|---|---|
| Cars Sold (Millions) | 1.3 | 10.3 | 20.7 |
| Average Selling Price (ASP) | $53,000 | $34,000 | $26,000 |
| Electric Vehicle Revenue (Billions) | $70 | $346 | $528 |
| Human-Driven Ride-Hail Revenue (Net, Billions) | $- | $54 | $- |
| Autonomous Ride-Hail Revenue (Net, Billions) | $- | $200 | $613 |
| Electric Vehicle Gross Margin (Ex-credits) | 24% | 34% | 23% |
| Total Gross Margin | 26% | 51% | 52% |
| Total EBITDA Margin** | 24% | 37% | 34% |
| Enterprise Value/EBITDA | 28 | 15.8 | 17 |
| Market Cap (Billions) | $553 | $4,442 | $7,939 |
| Share Price and CAGR*** | $184 | $1,400 (53%) | $2,500 (73%) |
| Free Cash Flow Yield | 1.90% | 4.60% | 4.20% |
Source: ARK Investment Management LLC, 2023.
In the table above, we share examples of two possible scenarios that correspond with our bear and bull price targets. Please note, however, that there are multiple outcomes within our million simulations that could correspond with the bull and bear price targets. Forecasts are inherently limited and cannot be relied upon as a basis for making an investment decision and are built on our modeling that reflects our biases and long-term positive view of the company. Please see additional disclosure below on forecasts and hypothetical performance. For informational purposes only and should not be considered investment advice, or a recommendation to buy, sell or hold any particular security. *Note: Figures are rounded for simplicity and consistent with reasonable variance in the forecast. 2022 total gross margin includes services, energy storage, and other. **Note: The similarity in bear and bull example EBITDA margins and total gross margins reflects our view of the most plausible economics of the two scenarios: Tesla’s human-driven ride-hail and autonomous business lines, which carry higher EBIT margins, make up 50% of EBITDA in the bear case. In the bear case, Tesla doesn’t scale as aggressively and can remain at a higher price point for longer, which benefits its margin structure. In the bull case, the gross margins and EBITDA margins on Tesla’s electric vehicle business decline as it sells into lower priced car segments, offset by the ride-hailing business lines, which make up a larger percentage of profits. ***Note: As of 4/18/23, of two possible scenarios that correspond with our bear and bull price targets, the CAGRs are for a 4.75Y time horizon. Please note, however, that there are multiple outcomes within our million simulations that could correspond with the bull and bear price targets.
Key Model Inputs: The following table presents the ranges for the key inputs to our forecast.
| Key Model Input Ranges | Worst Case | Downside (-1 Standard Deviation) | Upside (+1 Standard Deviation) | Best Case |
|---|---|---|---|---|
| Using Wright’s Law,* Electric Vehicle Gross Margins Never Exceed | 20% | 40% | 60% | 80% |
| Vehicle Capital Efficiency (Gross Capex Per Car, USD) | $14,000 | $7,000 | $2,000 | $1,500 |
| Maximum Annual Production Increase | 20% | 50% | 100% | 200% |
| Max % of 2027 production sold into human driven ride-hail network | 0% | 30% | 60% | 70% |
| Robotaxi Launch Period | 2030 | 2026 | Q4 2023 | Q4 2023 |
Source: ARK Investment Management LLC, 2023.
Forecasts are inherently limited and cannot be relied upon as a basis for making an investment decision and are built on our modeling that reflects our biases and long term positive view of the company. Please see additional disclosure below on forecasts and hypothetical performance. For informational purposes only and should not be considered investment advice, or a recommendation to buy, sell or hold any particular security. *Note: Wright’s Law: https://ark-invest.com/wrights-law/. The simulation drives production as a function of available cashflow for investment in electric vehicle (EV) manufacturing plants but imposes a fixed scaling constraint on Tesla’s ability to grow. Potentially, such constraints could stem from raw material and battery production bottlenecks encountered by the company.
Updates to ARK’s 2022 Tesla Model:
Updates to ARK’s 2022 open-source Tesla model include:
- Assumptions and inputs for autonomous ride-hail
- Capital efficiency estimates
- Stationary energy storage deployment
- Share price forecast pushed to 2027[4]
Assumptions and Inputs for Autonomous Ride-Hail
ARK has grown increasingly confident that Tesla will launch a robotaxi service soon. Our updated Monte Carlo model includes a range of launch dates, with late 2024 as the weighted average of all cases, as shown below.
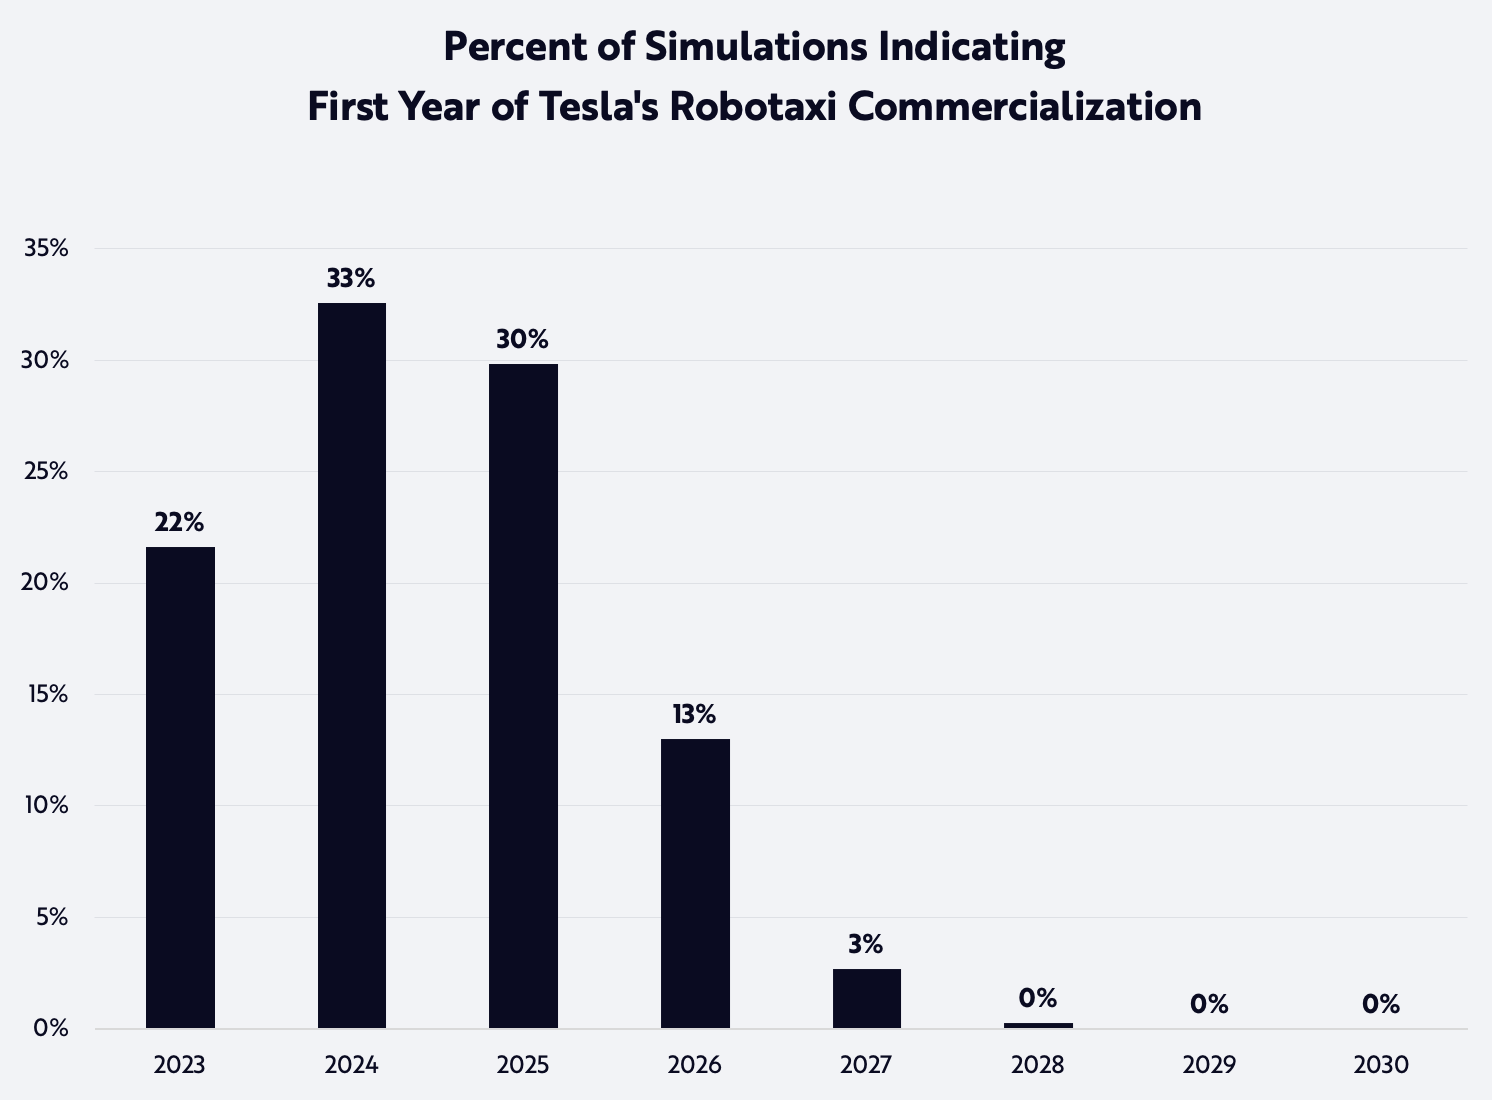
Source: ARK Investment Management LLC, 2023.
Forecasts are inherently limited and cannot be relied upon as a basis for making an investment decision and are built on our modeling that reflects our biases and long term positive view of the company. Please see additional disclosure below on forecasts and hypothetical performance. For informational purposes only and should not be considered investment advice, or a recommendation to buy, sell or hold any particular security.
The recent flurry of AI progress—from large language models like ChatGPT to image-generation diffusion models like Midjourney—should accelerate innovation in the autonomous driving industry. Tesla, for example, already uses transformers popularized by large language models for lane and intersection prediction.[5] In our view, Tesla’s vertical integration strategy and Dojo training supercomputer are key competitive advantages. Training currently runs at 100% capacity, suggesting that Tesla’s plan to expand Dojo by two orders of magnitude next year will help the company shorten the time between model updates.[6] Recent videos of its latest full self-driving (FSD) software update, including one of a driver who nearly completes a full ride-hail ride without touching the wheel, suggest that Tesla is close to launch in some geographies.[7]
Tesla’s data library should help prove statistically the safety of its vehicles, giving it significant advantage over peers in the regulatory approval process. Tesla’s customer-owned fleet drives more than 120 million miles per day, and over one million miles per day in FSD.[8] In contrast, in their multi-year lifetimes, Cruise and Waymo have reached just one million miles each driven on public roads with no one behind the wheel. Moreover, accident statistics suggest that Tesla already has achieved performance superior to human drivers. According to our research, adjusting for its use on surface streets only, Tesla’s FSD is 5X safer than a manually driven Tesla.
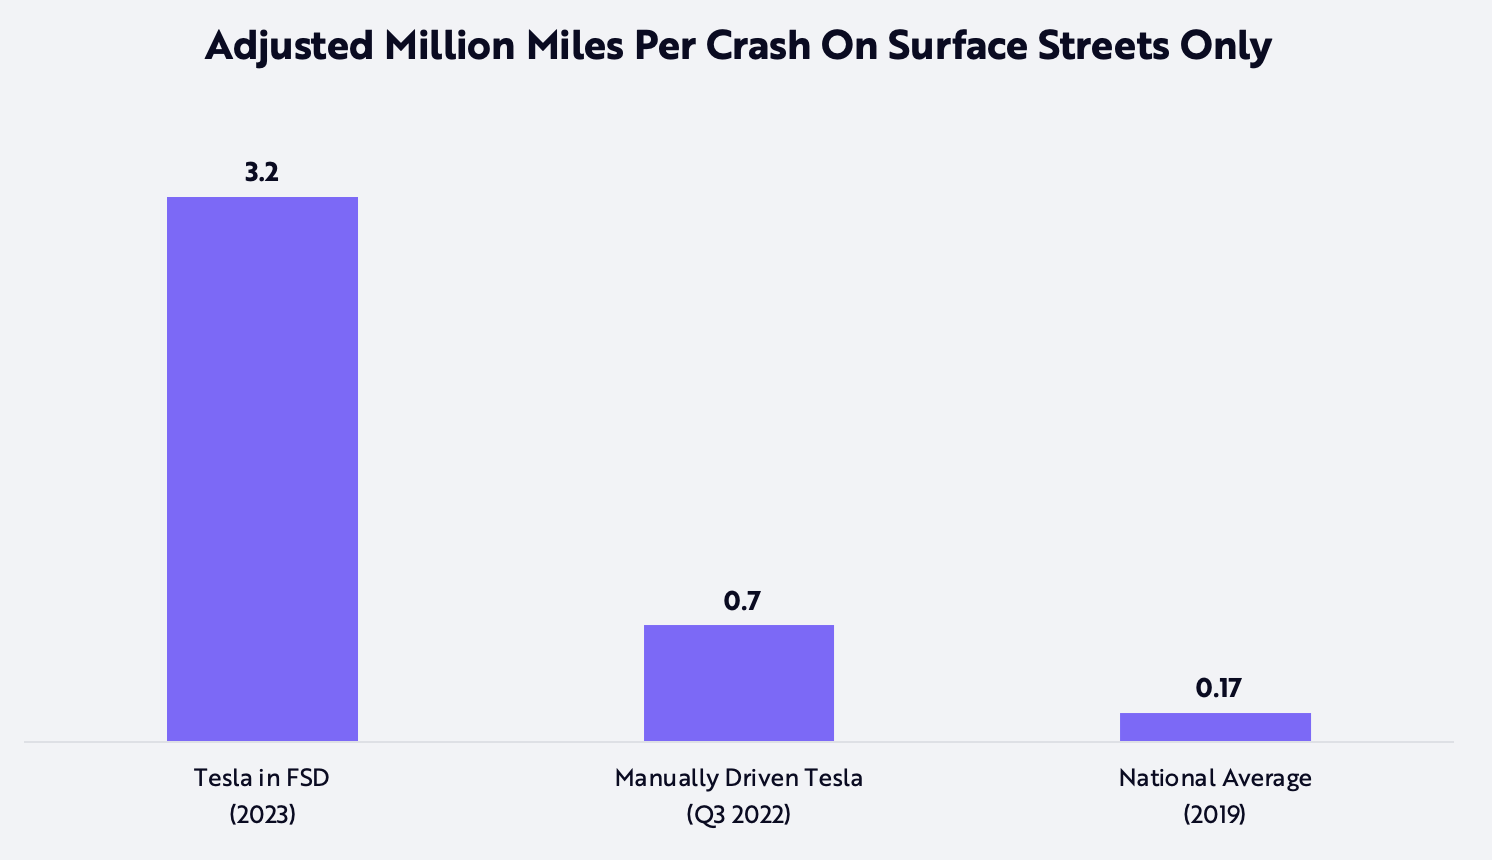
Source: ARK Investment Management LLC, 2023. Based on data from Tesla, Inc. 2023a; Tesla, Inc. 2023b; Tesla, Inc. 2023c; National Highway Traffic Safety Administration 2023; Bureau of Transportation Statistics 2023.
Note: Both the Non-Autopilot accident rate, labeled “Manually Driven Tesla” in the graph, and the national average were adjusted to surface-street only accident rates using the ratio of percent of accidents to miles driven on surface streets, including an adjustment for auto-pilot miles, which ARK estimates were ~10% of miles driven in Teslas. Note that this a global statistic and the US average is likely higher. Chart FSD data as of March 1, 2023. Five important caveats to consider: (1) a driver might disengage FSD in the most difficult driving moments, which could boost miles per accident; (2) FSD will not work in extreme weather; (3) while passenger cars make up the majority of vehicles in crashes and total miles, the national statistics are not confined to passenger cars; (4) our comparison includes all crashes, fatal and non-fatal; (5) The national average includes vehicles that do not have active safety features such as auto emergency braking, which are now standard on all new cars, including Teslas. Forecasts are inherently limited and cannot be relied upon as a basis for making an investment decision, and are built on our modeling that reflects our biases and long term positive view of the company. Please see additional disclosure below on forecasts and hypothetical performance. For informational purposes only and should not be considered investment advice, or a recommendation to buy, sell or hold any particular security.
Capital Efficiency Estimates
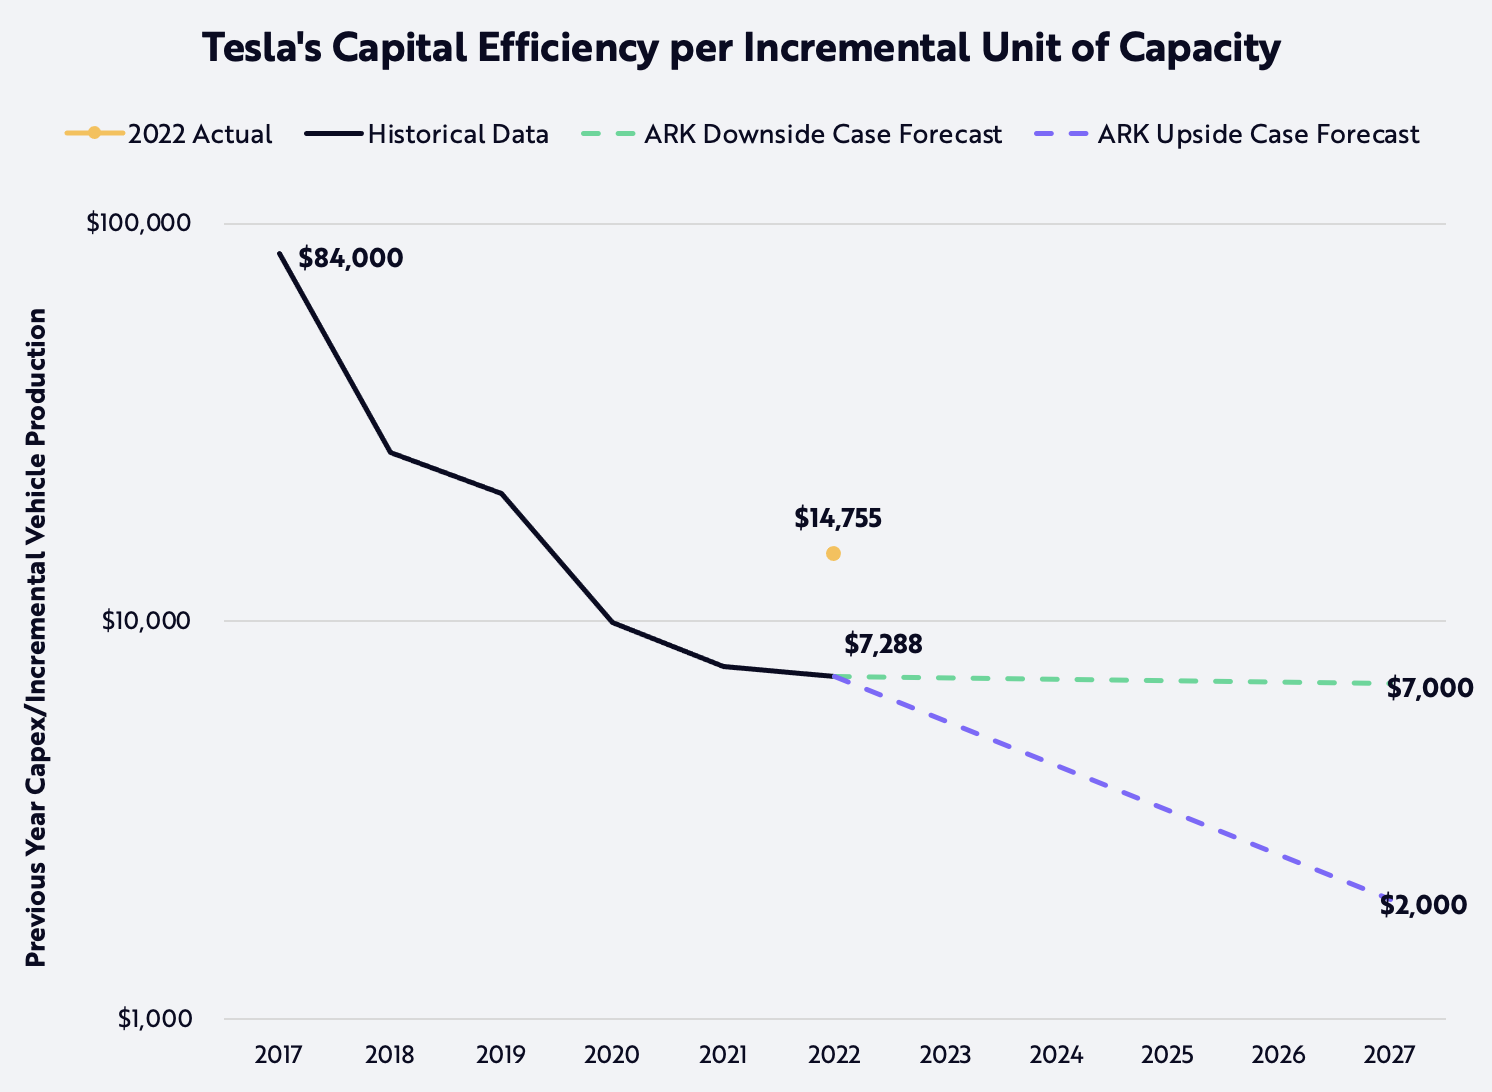
Tesla’s capital efficiency in 2027 remains the same as last year’s forecast for 2026. Capital expenditure per incremental unit of capacity improved from ~$84,000 when the Model 3 was ramping in 2017 to ~$7,700, in 2021. Simultaneous production ramps at two Gigafactories led capital efficiency measured at the end of the year to increase to $14,755 in 2022. Once the initial ramp of those factories is complete, the implied capital expenditure per unit capacity continues its decline to ~$7,000 as shown below.[9]
Source: ARK Investment Management LLC, 2023.
Note: In 2022, Tesla’s capital expenditure per unit of production capacity was $14,755, up from $7,683 in 2021. ARK believes that this is not an accurate measurement as capital investment was incurred with respect to Berlin and Austin Gigafactory in 2022, however, these factories had not yet hit volume production by year-end. As such, ARK believes that a more accurate measurement of Capital Efficiency is to adjust the 2022 vehicles produced to incorporate the initial production volume of these factories to get the true capital cost per vehicle. This re-calculated amount results in a capital efficiency rate of $7,288. Forecasts are inherently limited and cannot be relied upon as a basis for making an investment decision and are built on our modeling that reflects our biases and long term positive view of the company. Please see additional disclosure below on forecasts and hypothetical performance. For informational purposes only and should not be considered investment advice, or a recommendation to buy, sell or hold any particular security.
While these improvements indicate that Tesla could continue to increase margins, the more important takeaway is that capital is not a bottleneck limiting growth. Instead, Tesla should be able to grow as quickly as management bandwidth and supply constraints allow—two factors we model by constraining Tesla’s annual production growth using the “Max Annual Production Increase” input. Tesla’s Investor Day on March 1, 2023, highlighted its next generation vehicle architecture and manufacturing process, including steps to reduce the footprint and time associated with building factories, which should reduce bandwidth requirements and accelerate scaling.
Stationary Energy Storage Deployment
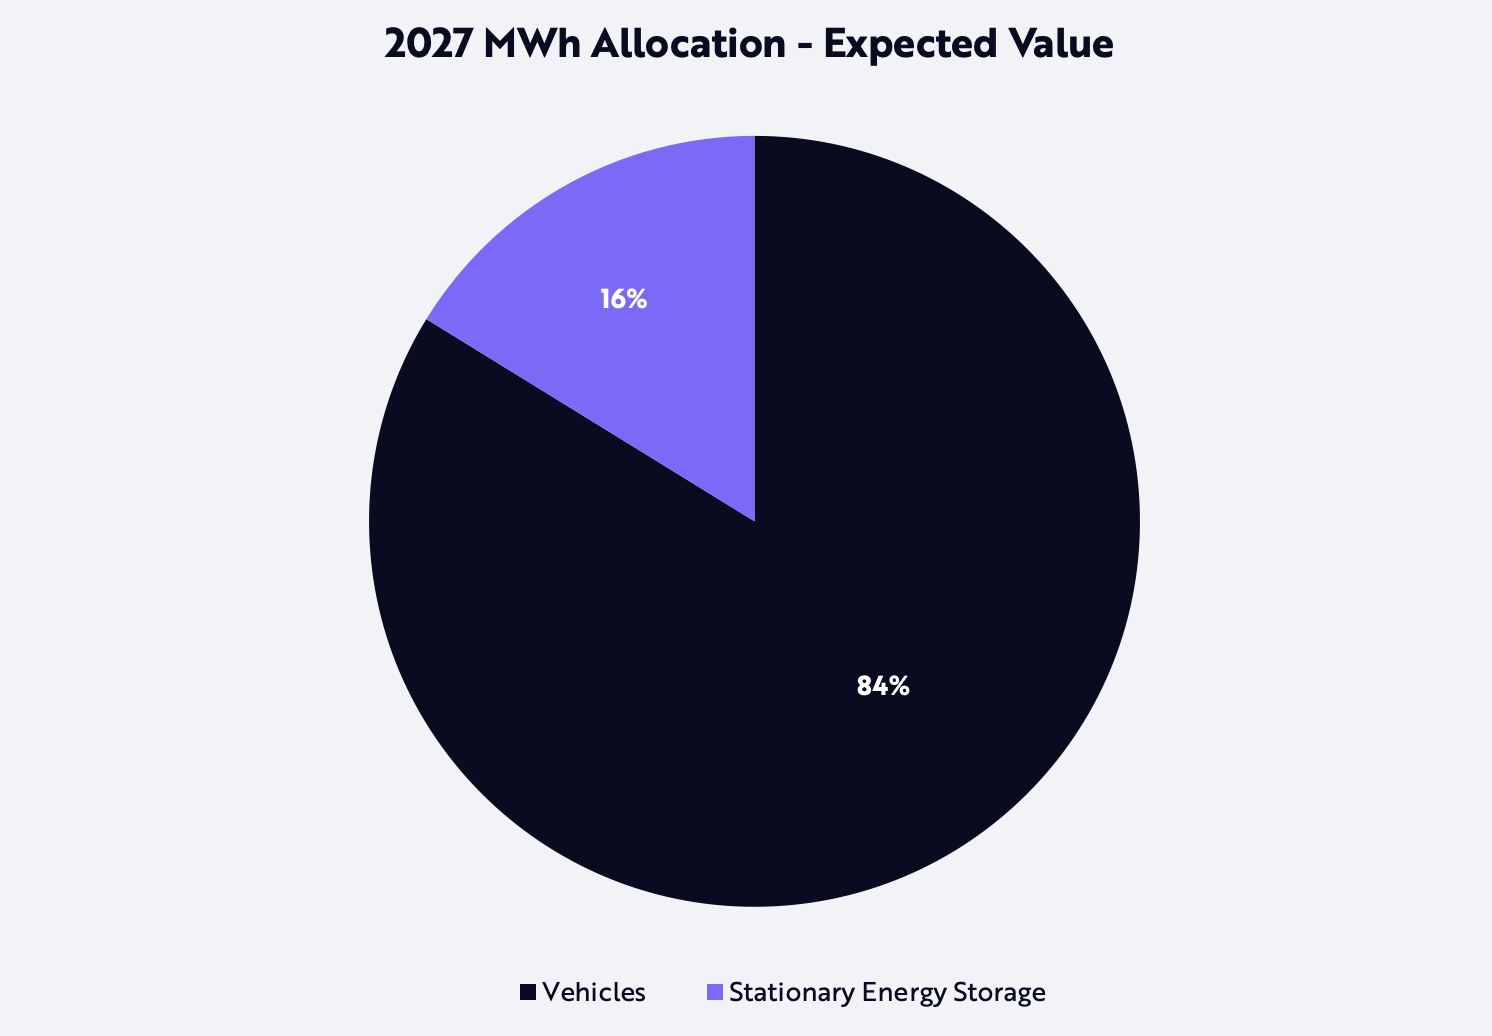
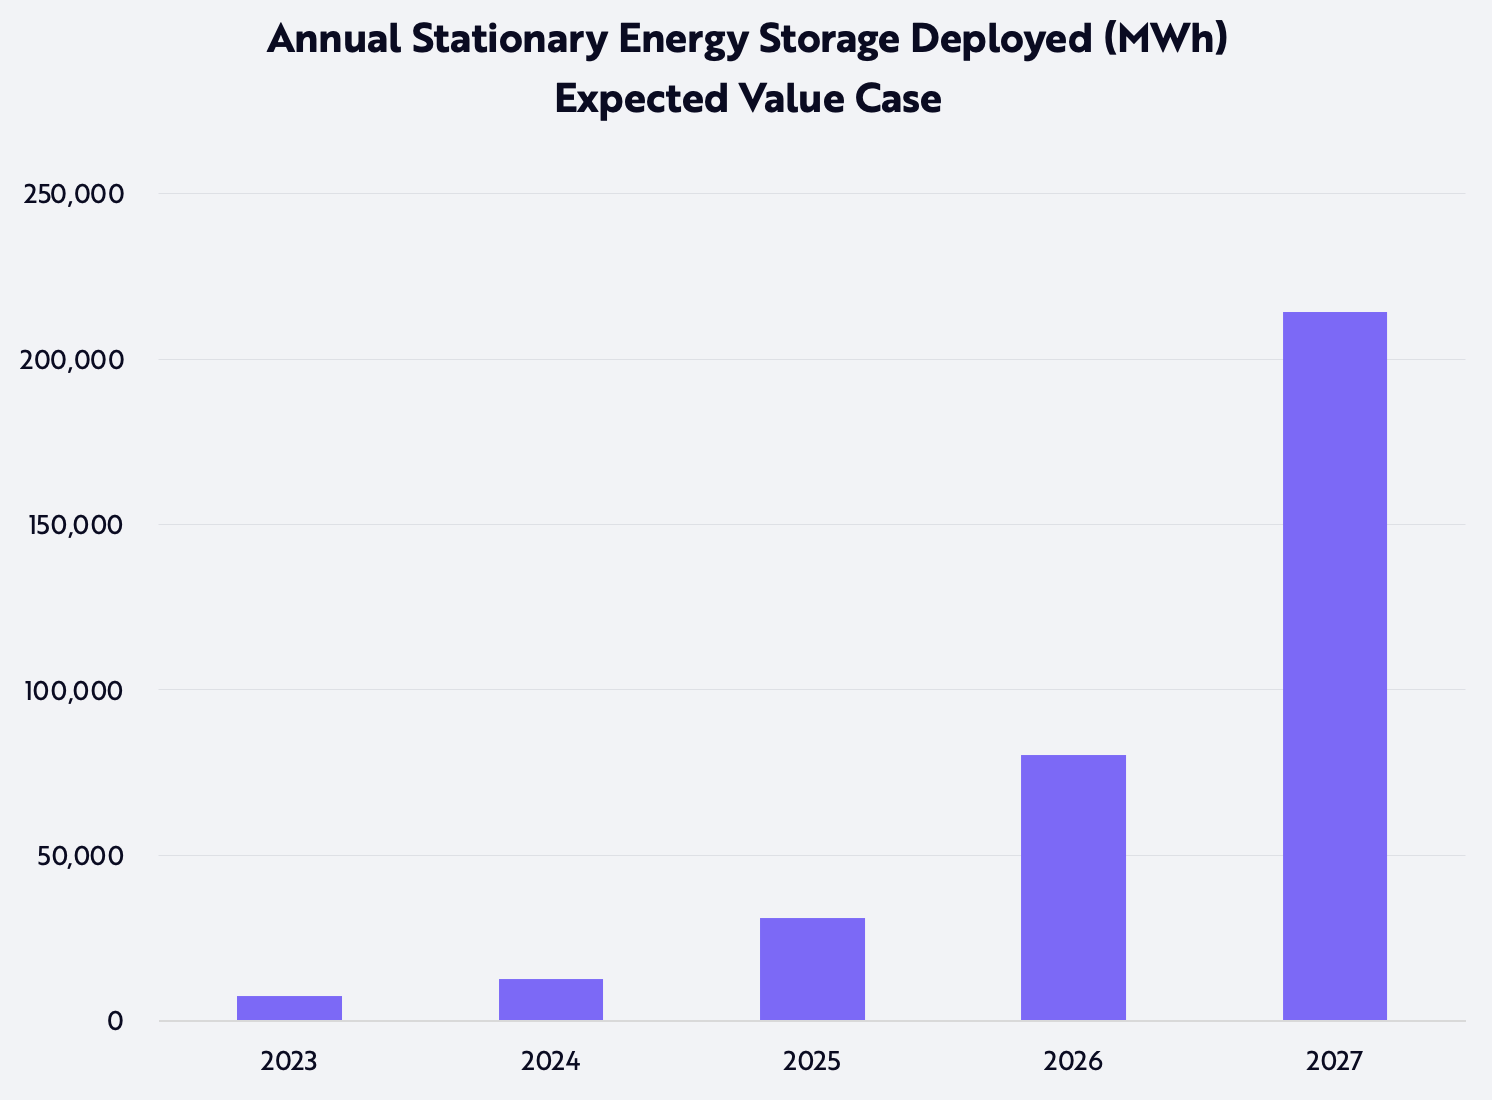
We expect Tesla to prioritize its vehicle business. To reflect this in this year’s model, we scale its stationary energy storage business only as the vehicle business becomes scaling constrained. According to our analysis, energy storage should contribute $6.6 billion, or 3%, to Tesla’s expected enterprise value in 2027. In ARK’s expected value, ~16% of all battery capacity goes into stationary energy storage and ~84% goes toward vehicles, resulting in ~200 GWh of stationary energy storage deployed in 2027, as shown in the second chart below.[10]
Source: ARK Investment Management LLC, 2023.
Forecasts are inherently limited and cannot be relied upon as a basis for making an investment decision and are built on our modeling that reflects our biases and long-term positive view of the company. Please see additional disclosure below on forecasts and hypothetical performance. For informational purposes only and should not be considered investment advice, or a recommendation to buy, sell or hold any particular security.
Source: ARK Investment Management LLC, 2023
Forecasts are inherently limited and cannot be relied upon as a basis for making an investment decision and are built on our modeling that reflects our biases and long term positive view of the company. Please see additional disclosure below on forecasts and hypothetical performance. For informational purposes only and should not be considered investment advice, or a recommendation to buy, sell or hold any particular security.
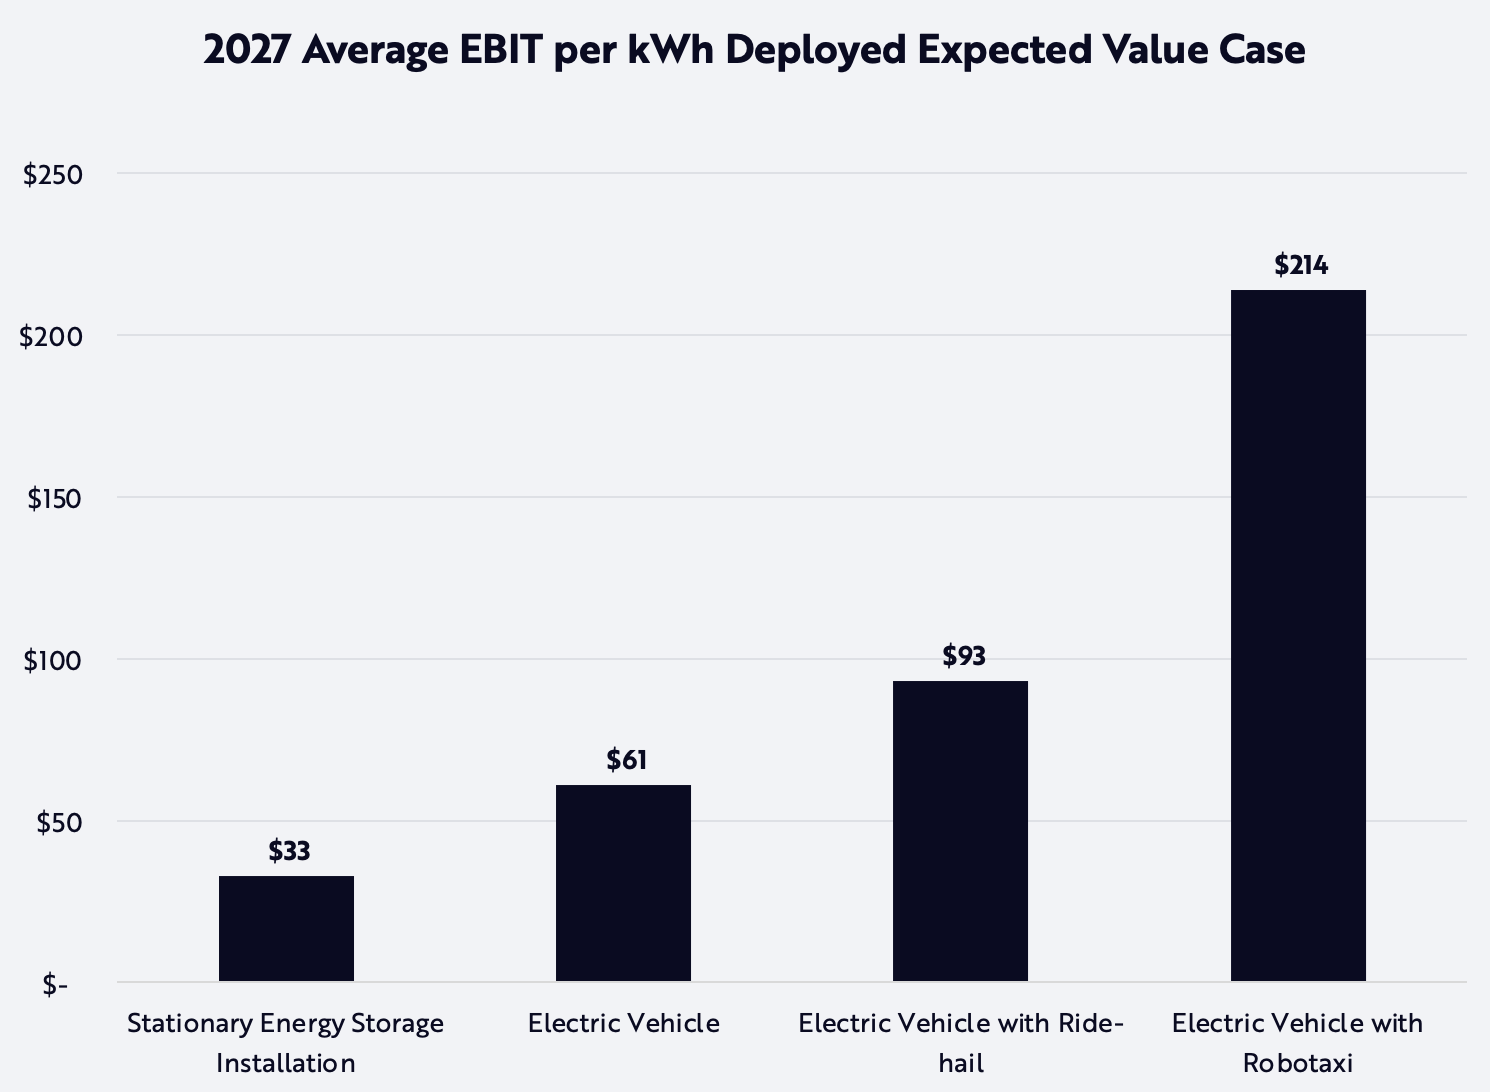
ARK’s research suggests Tesla will use batteries for the most profitable use case. A robotaxi should provide the highest investment return on batteries for Tesla, as shown below. With a robotaxi platform, Tesla should be able to generate earnings from both the vehicle sale and a recurring ride-hail revenue stream, which ARK believes could generate software-like margins. As Elon Musk has phrased it, autonomous ride-hail “probably will be the biggest asset value increase in history.”[11]
Source: ARK Investment Management LLC, 2023.
Forecasts are inherently limited and cannot be relied upon as a basis for making an investment decision and are built on our modeling that reflects our biases and long term positive view of the company. Please see additional disclosure below on forecasts and hypothetical performance. For informational purposes only and should not be considered investment advice, or a recommendation to buy, sell or hold any particular security.
According to our analysis, the stationary energy business should yield margins of ~20-25%. We have not modeled the option value embedded in Tesla’s ability to turn its battery systems into virtual power plants that allocate dynamically to overtaxed electrical grids, or returns from participating in capacity markets. Tesla also could accelerate its energy storage strategy by vertically integrating cryptocurrency mining and home HVAC systems. For now, we consider such options beyond the scope of this model.
Share Price Forecast
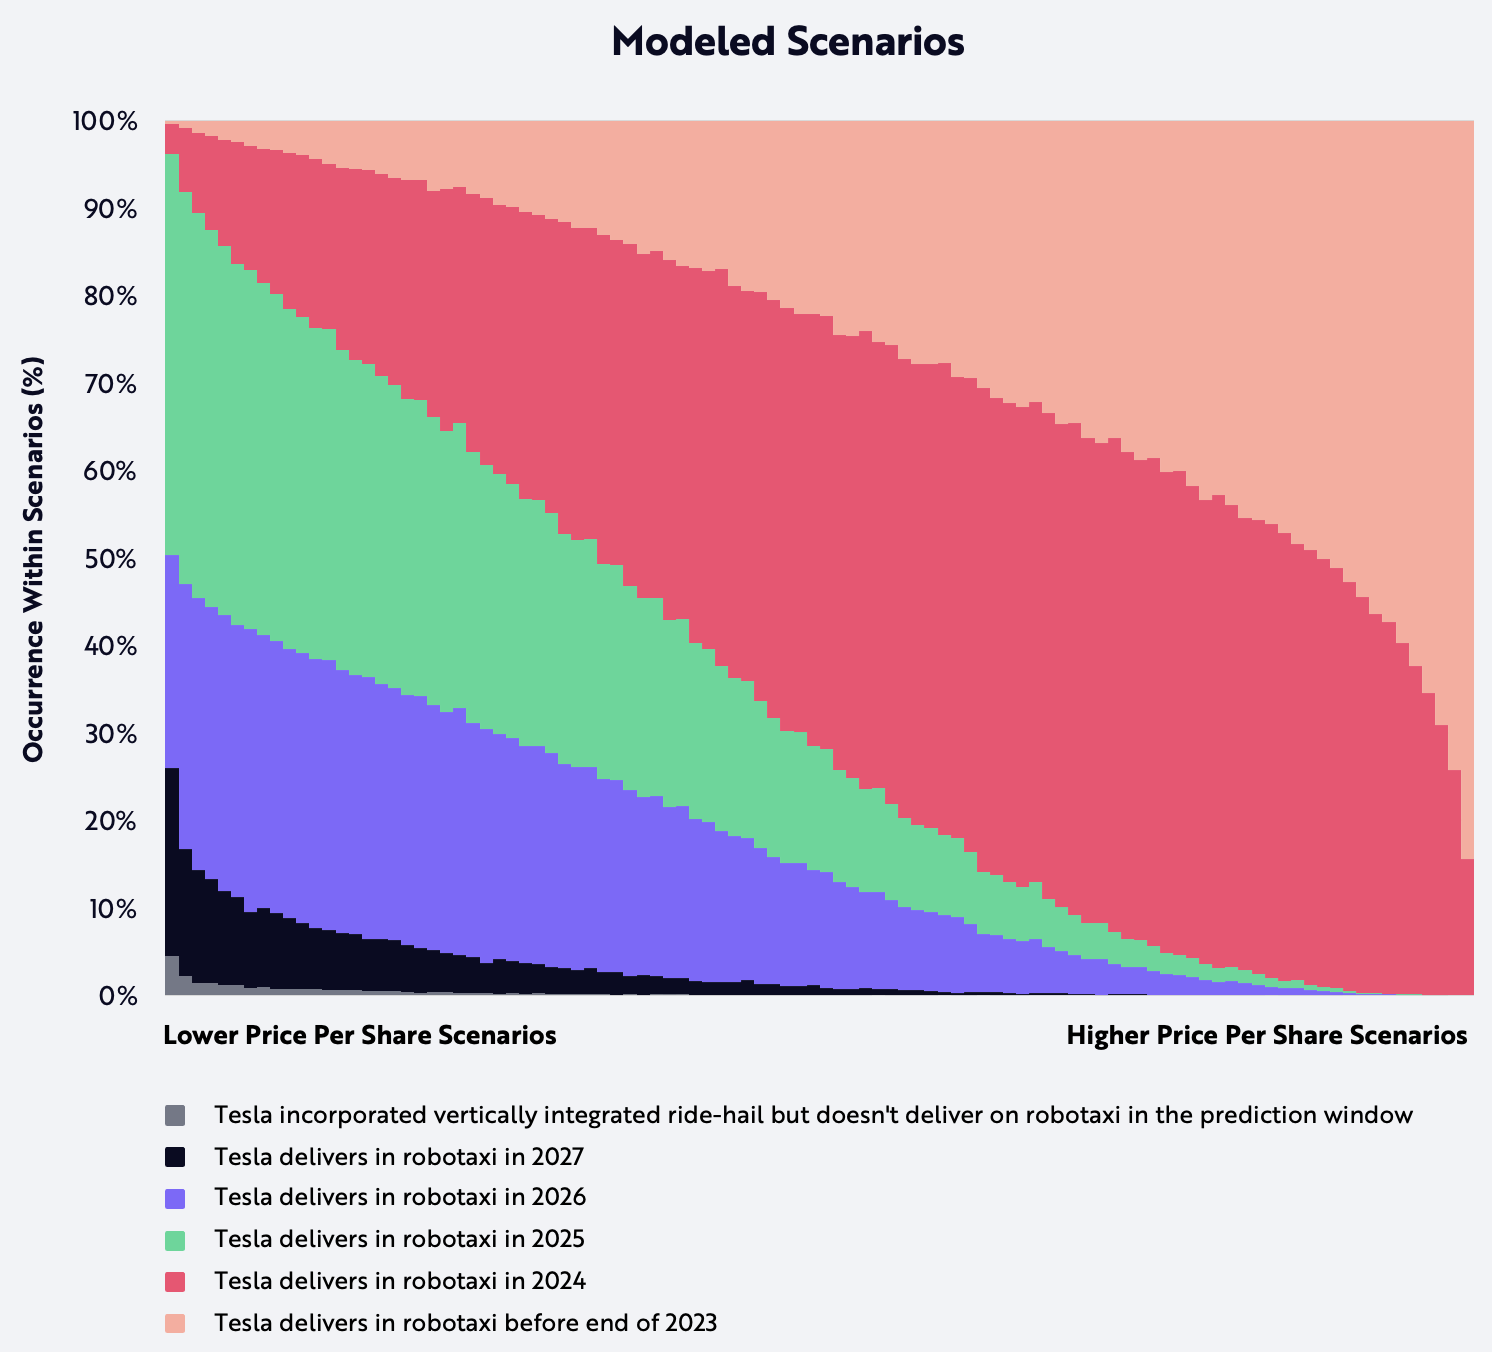
Our simulation is highly sensitive to the year in which Tesla launches robotaxis, as shown in the two charts below. The chart titled “Modeled Share Price Outcomes” represents the likely distribution of all possible price targets from our Monte Carlo analysis and identifies the bear and bull cases as the 25th and 75th percentile outcomes, respectively. “Expected value” is the average of all 1 million simulations.
The chart titled “Modeled Scenarios” illustrates the mix of robotaxi and human ride-hail outcomes that corresponds with each share price represented in the prior “Modeled Share Price Outcomes” chart. In our lowest price-per-share scenarios, Tesla launches a vertically-integrated, human-driven ride-hail service but does not launch a robotaxi network—as shown in dark grey on the lower left-hand corner) Although Tesla has not committed publicly to launching human-driven ride-hail, ARK previously detailed the strategic and tactical advantages of doing so. Note that in many of our higher price-per-share scenarios, Tesla launches a robotaxi network within the next two years.
Source: ARK Investment Management LLC, 2023.
Forecasts are inherently limited and cannot be relied upon as a basis for making an investment decision and are built on our modeling that reflects our biases and long term positive view of the company. Please see additional disclosure below on forecasts and hypothetical performance. For informational purposes only and should not be considered investment advice, or a recommendation to buy, sell or hold any particular security.
2027 Model Considerations That Are Not Key Drivers Of Our Price Estimates
As the updated model extends the forecast one year to 2027, we note the following considerations:
Debt Financing
The midpoint of our assumptions suggests that Tesla will fund 25% of the buildout of future factories with debt.
Bitcoin Assumptions
We updated our bitcoin assumptions in line with ARK’s current bitcoin expectations.[12] The digital asset continues to have less than a 5% impact on our 2027 expected price per share.
Equity Raise
As in last year’s model, we assume Tesla will use ~$3 billion in additional equity for incentive compensation. Given the cash we expect from the autonomous ride-hail network and electric vehicle sales, we do not anticipate that Tesla will need to raise more capital.
Balance Sheet
We have made conservative assumptions about strategic financial decisions. We do not believe these decisions will be primary drivers of Tesla’s stock price appreciation:
- Tesla holds cash and bitcoin on its balance sheet and does not benefit from any yield-generating assets.
- With more cash than debt on its balance sheet, Tesla does not use the cash to pay down debt. The interest cost of the debt remains at 4%.
- Tesla does not repurchase shares.
Note: The assumptions above could lead to divergences between our forecast of Tesla’s share price and the actual price of Tesla shares. Our modeling cannot include all variables that will impact Tesla’s share price and our assumptions could be inaccurate and incomplete. Moreover, our assumptions are subject to change as more information becomes available. Our estimates and forecasts are subject to risks and limitations and should not be relied upon for individual investment decisions.
Business Opportunities Not Included In The Model
We do not believe that either Dojo training-as-a-service or Tesla’s Optimus humanoid robot will contribute significantly to Tesla’s value within our five-year investment time horizon, though they could drive value over a longer time horizon.
Risks and Limits of Our Monte Carlo Model
ARK’s 41 independent variables are meant to cover all scenarios that we see as plausible outcomes for Tesla over the next five years. An unexpected event, such as Elon Musk’s sudden departure from the company, or a natural disaster or pandemic, could cause actual results to differ from our expectations.
Conclusion
Given the updates outlined in this article, ARK’s price target for Tesla is $2,000 per share in 2027. Our bear and bull cases suggest that TSLA could be valued between ~$1,400 and $2,500 per share in 2027. We have published our simulation model on GitHub and invite readers to explore and test assumptions and/or craft visualizations in the simulations.
Works Cited
- ARK Investment Management, LLC. 2023. “Big Ideas 2023.” ARK-Invest. https://ark-invest.com/big-ideas-2023/.
- Bureau of Transportation Statistics. 2023. “Roadway Vehicle-Miles Traveled (VMT) and VMT per Lane-Mile by Functional Class.” BTS. https://www.bts.gov/content/roadway-vehicle-miles-traveled-vmt-and-vmt-lane-mile-functional-class.
- Musk, E. 2023. “Team is closing the loop on interventions very rapidly. To get enough training examples for potential serious accidents, we have to run them in sim, as we have so few in the fleet, despite doing ~1M miles per day of FSD.” Twitter. https://twitter.com/elonmusk/status/1643144343254110209?s=20.
- National Highway Traffic Safety Administration. 2023. “Traffic Safety Facts Annual Report Tables.” NHTSA. https://cdan.nhtsa.gov/tsftables/tsfar.htm.
- Tesla, Inc. 2022. “Tesla AI Day 2022.” YouTube. https://www.youtube.com/watch?v=ODSJsviD_SU.
- Tesla, Inc. 2023a. “2023 Investor Day.” YouTube. https://www.youtube.com/watch?v=Hl1zEzVUV7w.
- Tesla, Inc. 2023b. “Master Plan Part 3.” Tesla. https://www.tesla.com/ns_videos/Tesla-Master-Plan-Part-3.pdf.
- Tesla, Inc. 2023c. “Tesla Vehicle Safety Report.” Tesla. https://www.tesla.com/VehicleSafetyReport.
- Tesla, Inc. 2023d. “Tesla, Inc. Q4 2022 Financial Results and Q&A Webcast.” Tesla. https://ir.tesla.com/webcast-2023-01-25.
- Whole Mars Catalog. 2023. “Can Tesla Full Self-Driving Beta 11.3.3 Handle Real Ride Sharing Rides?” YouTube. https://www.youtube.com/watch?v=nW-3KcEKjpQ.
Disclosure
The forecasted performance and price estimates herein are subject to revision by ARK and provided solely as a guide to current expectations. There can be no expectation that the specific security will achieve such performance or that there will be a return of capital. Past performance is not indicative of future results.
FORECASTED PERFORMANCE RESULTS ARE HYPOTHETICAL AND HIGHLY SPECULATIVE, AND PRESENT MANY RISKS AND LIMITATIONS. The recipient should not consider these estimated prices alone in making an investment decision. While ARK believes that there is a sound basis for the forecasts presented, no representations are made as to their accuracy, and there can be no assurance that such forecasts or returns will be achieved by the specific security.
The recipient is urged to use extreme caution when considering the forecasted performance, as it is inherently subjective and reflects ARK’s inherent bias toward higher expected returns. Any higher returns should be viewed as a measure of the relative risk of such investments, with higher forecasted performance generally reflecting greater risk. There is no guarantee that any results will align with the forecasted performance, and they might not be predictive. Some or all results may be substantially lower than projected results and, as with any investment, it is possible that you could lose money.
FORECASTED performance results (single security model simulation forecasts) have many inherent limitations. A recipient account might or might not hold this single security, and the account performance will be affected in proportion to its holding size and the amount of price fluctuation over time. No representation is being made that any client account will or is likely to achieve profits or losses tied to a security in the security model forecasts. In fact, there could be significant differences between these forecasted performance results and the actual results realized.
Forecasted performance has not been achieved by the security, and like all modeled, projected, or hypothetical performance, it is important to note that there are multiple versions of a model, and ARK has a conflict of interest in that we have an incentive to show you the best performing results. These forecasts rely on models, which calculate hypothetical performance. Several of the limitations of hypothetical performance models include: 1) reliance on a variety of data obtained from sources that are believed to be reliable, but might be incorrect, inaccurate or incomplete and ARK does not guarantee the accuracy or completeness of any information obtained from any third party, 2) potential inclusion of inherent model creation biases, data discrepancies and/or calculation errors that could cause actual results to differ materially from those projected, 3) NO reflection of the impact that material economic and market factors might have had on investment decisions that would have been in actual portfolios being managed at the time and do not involve market risk, and 4) NO guarantee of future investment results. The forecasted results rely on assumptions, forecasts, estimates, modeling, algorithms and other data input by ARK, some of which relies on third-parties, that could be or prove over time to be incorrect, inaccurate or incomplete.
The forecasted returns are based on a variety of criteria and assumptions, which might vary substantially, and involve significant elements of subjective judgment and analysis that reflect our own expectations and biases, which might prove invalid or change without notice. It is possible that other foreseeable events that were not taken into account could occur. The forecasted performance results contained herein represent the application of the simulation models as currently in effect on the date first written above, and there can be no assurance that the models will remain the same in the future or that an application of the current models in the future will produce similar results because the relevant market and economic conditions that prevailed during the performance period will not necessarily occur. The results will not be updated as the models change, or any information upon which they rely changes. There are numerous other factors related to the markets in general or to the public equity security specifically that cannot be fully accounted for in the preparation of forecasted performance results, all of which can adversely affect actual results. For these reasons, forecasted performance results will differ, and could differ significantly from actual results. FORECASTED PERFORMANCE RESULTS ARE SUBJECT TO REVISION AND PRESENTED FOR ILLUSTRATIVE PURPOSES ONLY.
While ARK’s current assessment of the subject company may be positive, please note that it might be necessary for ARK to liquidate or reduce position sizes prior to the company attaining any forecasted valuation pricing due to a variety of conditions including, but not limited to, client specific guidelines, changing market conditions, investor activity, fundamental changes in the company’s business model and competitive landscape, headline risk, and government/regulatory activity. Additionally, ARK does not have investment banking, consulting, or any type of fee-paying relationship with the subject company.
Related Research