Actively Managed Equity
 Overview: All Strategies
 Investor Resources
 Indexed Equity
 Private Equity
 Digital Assets
 Invest In The Future Today
 Take Advantage Of Market Inefficiencies
 Make The World A Better Place
 Articles
 Podcasts
 White Papers
 Newsletters
 Videos
 Big Ideas 2024
Strategic Allocation To Innovation: A Comparison to Emerging Markets


We believe a strategic allocation to innovation probably will evolve into a sub-asset class, as did the “niche” strategy of the 1980s—emerging markets. In the late 1980s and early 1990s, investors had little, if any, exposure to what has evolved into 13% of the global equity market capitalization and 60% of global gross domestic product (GDP) on a purchasing power parity basis.[1] In 1981, while proposing a global public equity fund for developing countries, Antoine van Agtmael of the International Finance Corporation (IFC) coined the term “emerging markets”. The IFC began tracking total return data for ten developing markets and discovered “attractive results…making a good case for increased investment.”
Initially, many investors resisted exposure to developing markets based on the volatility associated with geopolitical uncertainties, corporate governance, and liquidity. With time, however, they observed low correlations between and among the stock returns of the various developing nations, as well as growth rates that far surpassed those in the developed world. Investors concluded that broad-based exposure to developing markets offered enough diversification to minimize idiosyncratic risks and lower volatility, resulting in higher risk-adjusted return.
Launched in 1988, the MSCI Emerging Markets Index marked the beginning of a new investable sub-asset class for public equity portfolios. The index included only ten developing nations but enabled allocators to track the local equity markets of rapidly growing emerging nations.
During the late eighties and early nineties, allocators that made a strategic decision to reallocate some of their global equity portfolio from developed markets to emerging markets enjoyed the benefits of increased relative returns. As shown in Figure 1 below, emerging markets stocks, represented by the MSCI Emerging Markets Index outperformed developed markets stocks, represented by MSCI World Index:
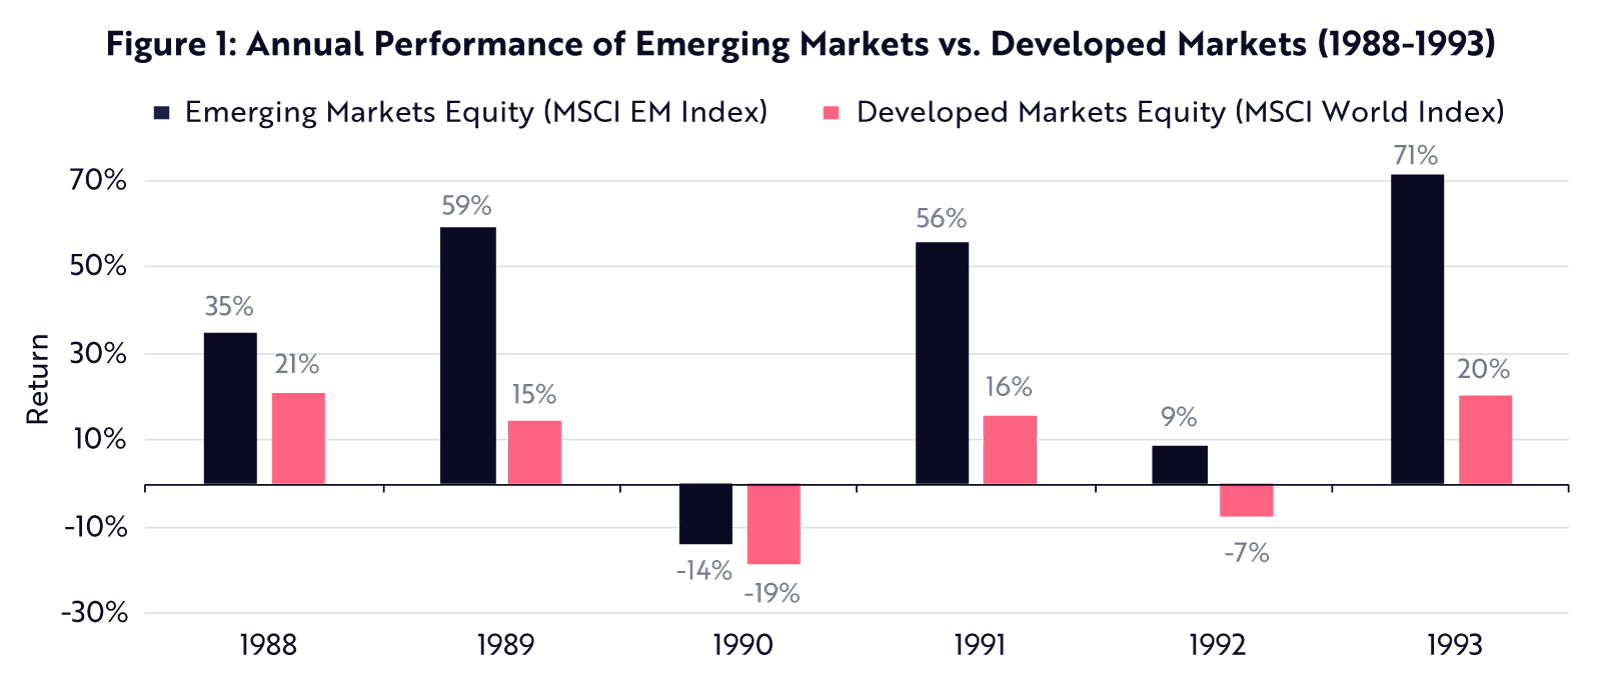
Source: ARK Investment Management LLC, 2020 | Data Source: Bloomberg
We believe innovation will evolve in a similar fashion. ARK has identified five major innovation platforms and 14 transformative technologies that are likely to provide significant growth and diversification benefits. As costs continue to decline, these technologies are approaching tipping points that based on our white paper ‘Disruptive Innovation: Why Now?’ should unleash waves of demand across sectors and geographies and, in turn, spawn more innovation. While many investors perceive innovative technologies and their associated stocks as volatile and risky, each of them tends to be idiosyncratic, such that collectively we think they can provide enough diversification to minimize risks and lower volatility.
While many investors perceive innovative technologies and associated stocks as volatile and risky, ARK believes they can provide enough diversification to minimize risks and lower volatility.‘Pure play’ stocks associated with technologies like DNA sequencing, for example, have a fairly low correlation to those associated with collaborative robots or blockchain technology. In fact, based on Figures 2 and 3, the correlations between and among disruptive technologies can be lower than those between and among S&P 500 sectors. In Figure 2, the S&P sectors are represented by ETFs selected by ARK that are intended to represent each of the 11 S&P sectors.[2][3] In Figure 3, the disruptive technologies are represented by individual stocks selected by ARK to represent each of the 14 transformative technologies. The average correlation between S&P sectors is 0.55, more than double the 0.22 associated with the 14 disruptive technologies.[4] As with emerging markets, a diversified basket of innovative stocks has the potential to enhance risk-adjusted returns in global equity portfolios.
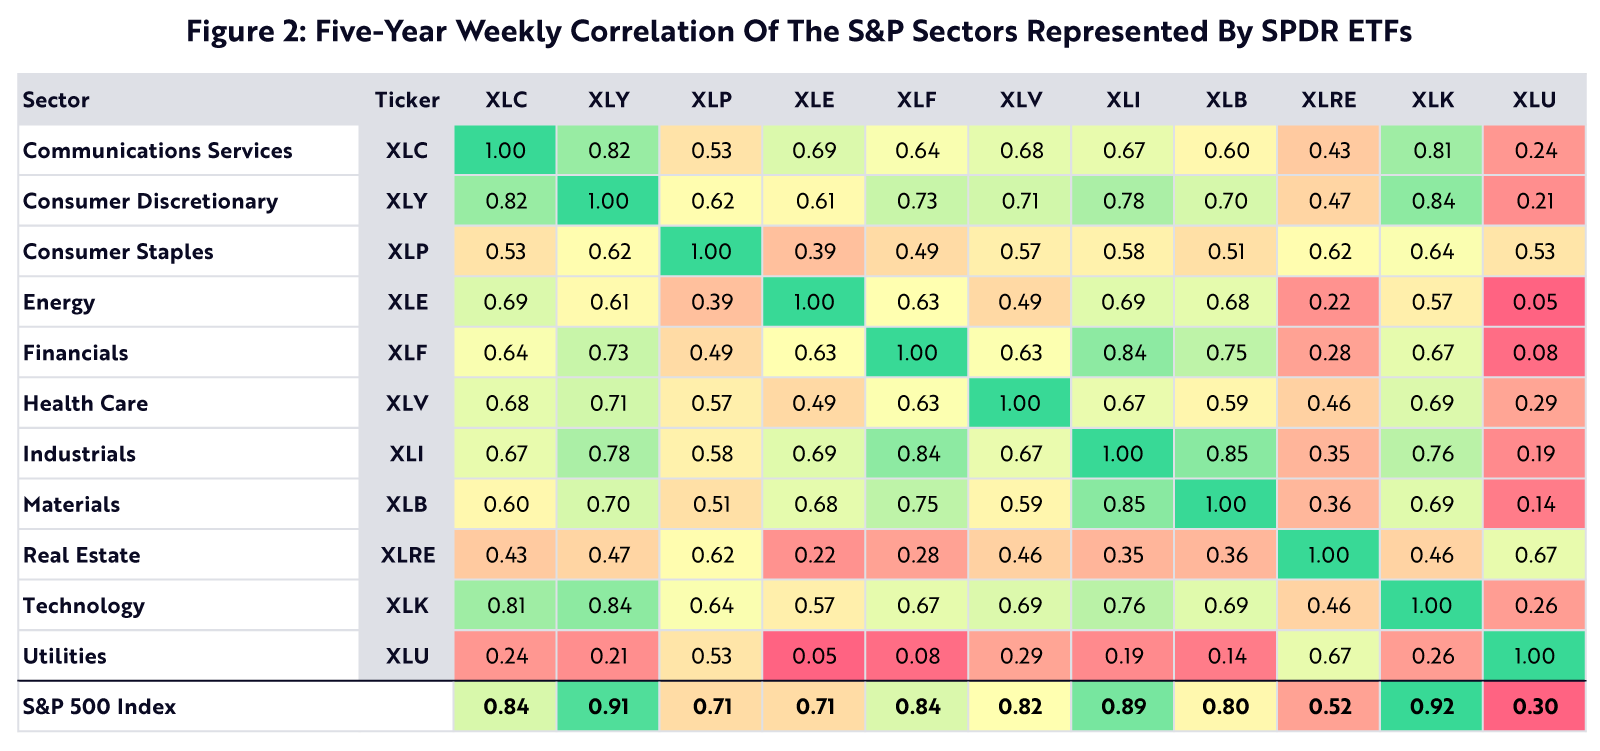
Source: ARK Investment Management LLC, 2020 | Data Source: Bloomberg. Five-year weekly fund price correlation data as of December 31, 2019. For informational purposes only and should not be considered investment advice, or a recommendation to buy, sell or hold any particular security. The representative securities identified were selected based on ARK’s methodoloy. The reader should not assume that an investment identified was or will be profitable. Data is unreconciled and from a third party system.
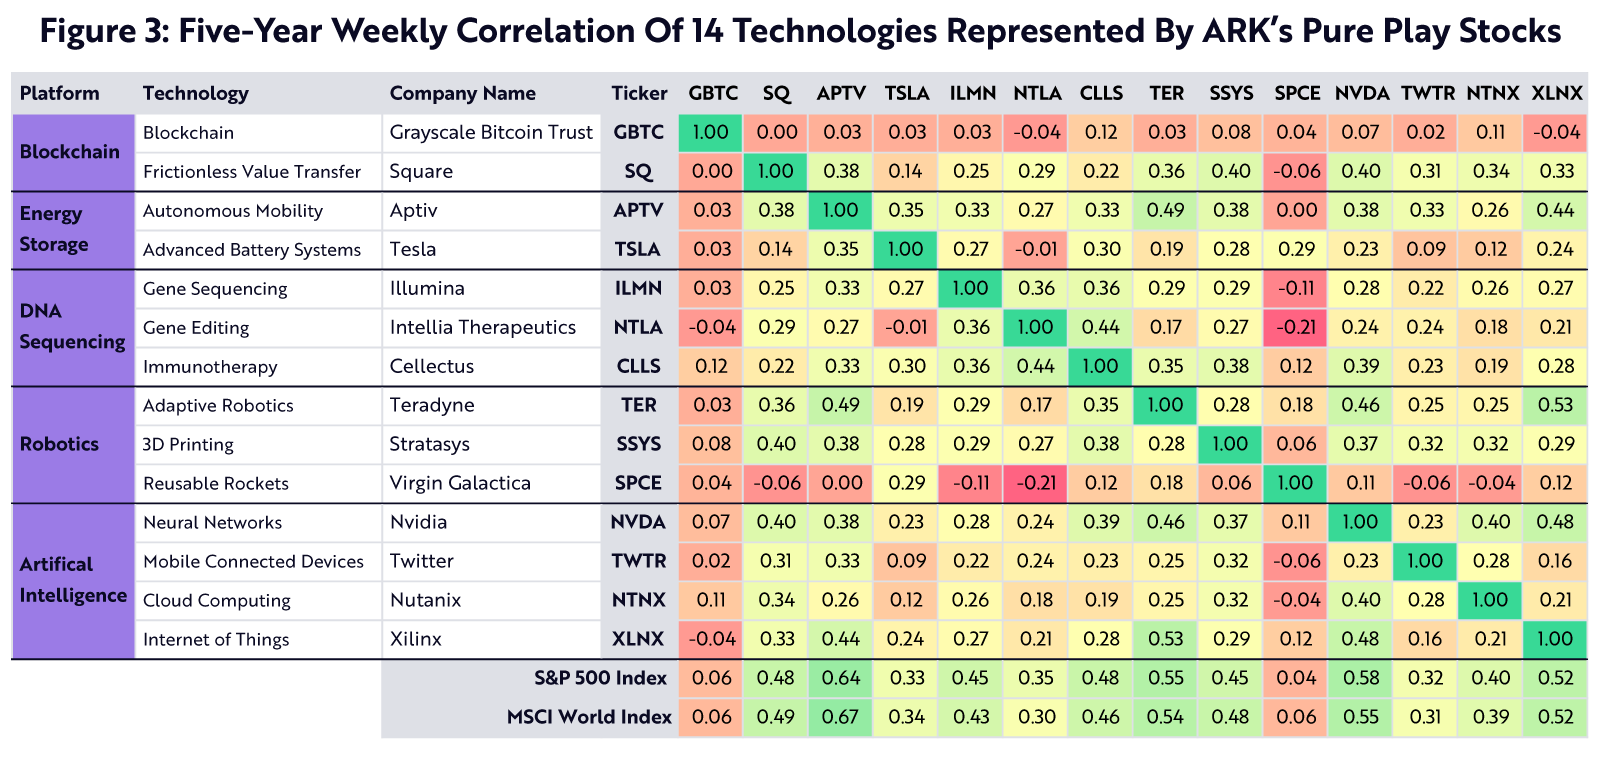
Source: ARK Investment Management LLC, 2020 Data Source: Bloomberg. Five-year weekly stock price correlation data as of December 31, 2019 For informational purposes only and should not be considered investment advice, or a recommendation to buy, sell or hold any particular security. There is no assurance that ARK will make any investments with the same or similar characteristics as any investment presented. The investments identified and described do not represent all of the investments purchased or sold for client accounts. The representative securities identified were selected based on ARK’s view of the correlation to the noted platforms and technologies. The reader should not assume that an investment identified was or will be profitable. There is no assurance that any securities identified, will comprise ARK client accounts at the time you receive this document. Data presented is unreconciled and from a third party system.
In periods of market distress and volatility, investors often recoil from stocks associated with innovation, especially those not in benchmarks, perceiving them to have high betas and asymmetric downside risks. As a result, while investors are flocking back to their benchmarks to lower tracking error in the early stages of a correction, innovation-based strategies tend to underperform broad-based equity indices.
Ironically, during periods of fear, uncertainty, and doubt, businesses and consumers can sometimes be more willing to change their behavior and try innovative products and services that are more productive, cheaper, and faster. Innovation takes root and typically gains significant market share during tumultuous times, explaining the adage that new leadership emerges toward the end of a bear market. As a result, we believe stocks associated with innovation typically recover much faster than many of the value traps that increasingly populate the traditional indices. Indeed, during these days of explosive innovation, the greater risk during tumultuous times in the market could be in increasing exposure to the incumbents that dominate broad-based indices. The incumbents stand to be disrupted. As mature companies cut costs and R&D to salvage profitability, they may become even less competitive and, in a vicious cycle, lose even more market share.
As was the case with emerging markets, ARK believes investors are likely to evolve asset allocation and portfolio construction strategies, increasingly incorporating disruptive innovation and identifying stocks poised to benefit from trends misperceived, misunderstood, and mispriced in the market. An allocation to innovation has the potential to increase risk-adjusted returns in global equity portfolios in the long term.
To learn more, please read our full white paper:
Click here to download the full white paper.
Related Research

Why This Bull Market May Continue to Surprise