Actively Managed Equity
 Overview: All Strategies
 Investor Resources
 Indexed Equity
 Private Equity
 Digital Assets
 Invest In The Future Today
 Take Advantage Of Market Inefficiencies
 Make The World A Better Place
 Articles
 Podcasts
 White Papers
 Newsletters
 Videos
 Big Ideas 2024
Tesla's Potential Trajectory During the Next Five Years


The information presented reflects the views and assumptions of the authors at the time of publication. Please note that this research is at least one year old and the authors’ current views may materially differ from those presented without notice. The results will not be updated as ARK’s internal models change, or any information upon which ARK relies upon changes.
In August 2018, ARK published an open letter with an extract of our TSLA valuation model communicating why we believed taking Tesla private at $420 per share would deprive shareholders of significant returns. Since then ARK has updated its TSLA valuation regularly. Based on new research, we are sharing our latest model to clarify what we believe is TSLA’s potential.
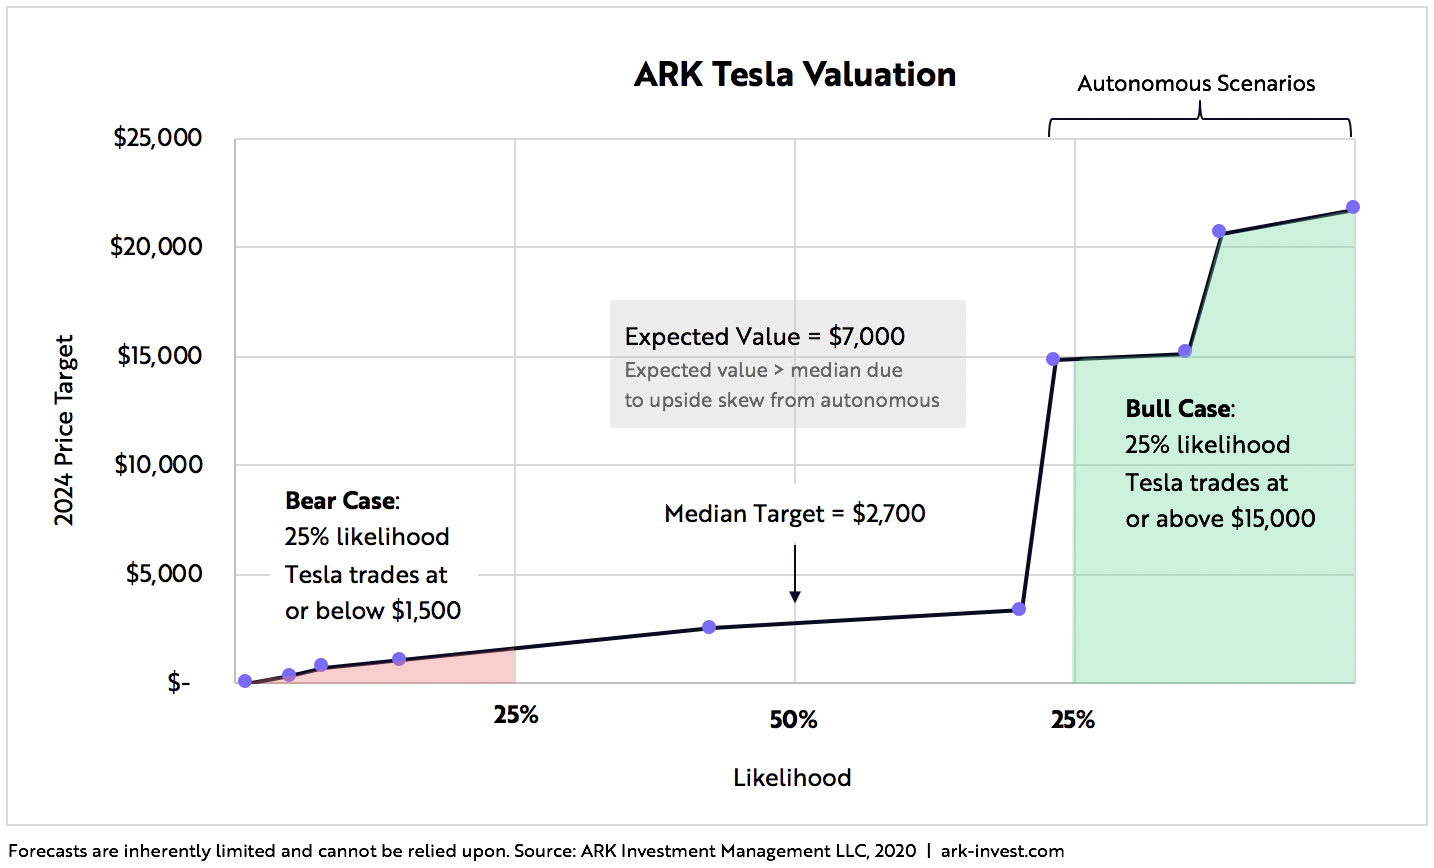
Based on our updated expectations for electric vehicle (EV) cost declines and demand, as well as our estimates for the potential profitability of robotaxis, our 2024 expected value per share for TSLA is $7,000. To arrive at that base case, ARK has developed a probability analysis with bear and bull price estimates, as detailed below:
| ARK’s Predicted Scenarios | 2024 Price Target | Significance |
Expected Value | $7,000 | This projection is our base case for TSLA’s stock price in 2024 based on our probability matrix. |
Bear Case | $1,500 | We believe that there is a 25% probability that Tesla could be worth $1,500 per share or less in 2024. |
Bull Case | $15,000 | We believe that there is a 25% probability that Tesla could be worth $15,000 per share or more in 2024. |
Shown in the following graph is our probability distribution for TSLA’s price target:
How did we arrive at these results? We’ll explain the methodology below, focusing in the second half of this piece on the research that informs our assumptions.
Key Inputs
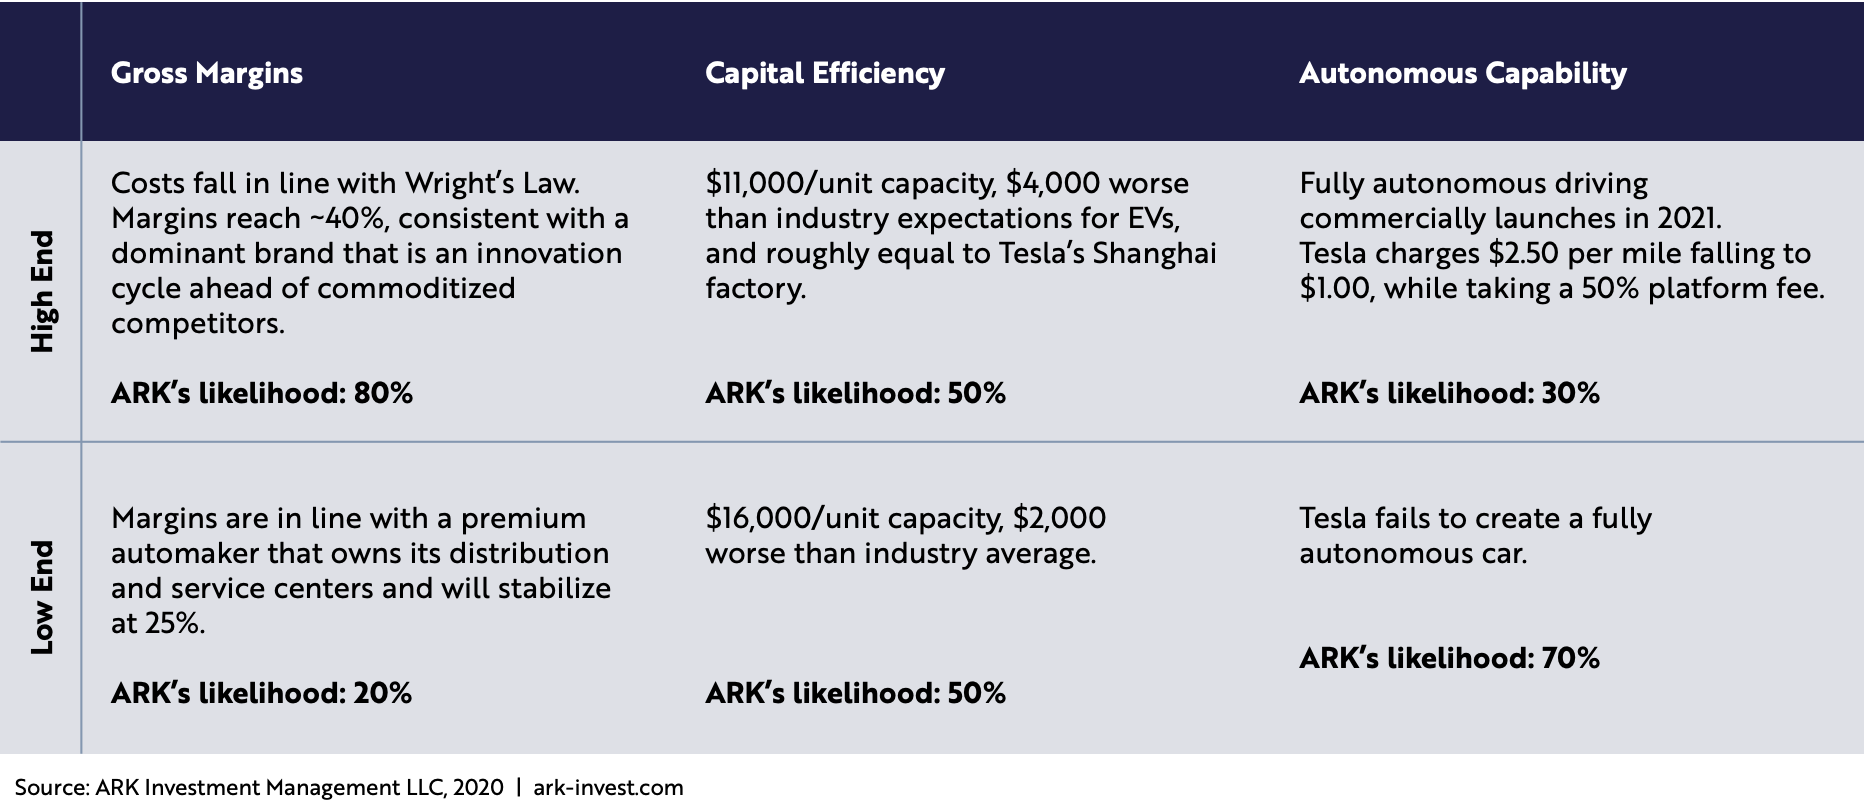
ARK’s research and modeling suggests that three key independent variables are critical to understanding Tesla’s potential:
- Gross Margins – Will Tesla’s cost of manufacturing vehicles continue to fall in line with Wright’s Law?[1] If so, what will be the average selling price of Tesla’s vehicles?
- Capital Efficiency – What is Tesla’s cost per unit to build new production capacity?[2]
- Autonomous Capability – Can Tesla launch a fully autonomous taxi service successfully?
The table below summarizes the upper and lower bounds for each of these variables.
The Valuation
ARK’s valuation is based on ten scenarios, each of them probability weighted. Our bull case for Tesla does not assume the most aggressive inputs for the three variables noted above. Instead we estimate probabilities for each independent variable, resulting in 8 scenarios. We’ve also included 2 scenarios that encompass worst case factors: 1) a 3% chance that Tesla is unable to access capital markets, lower costs, launch an autonomous taxi network, and become capital efficient, and 2) a 1% chance of a black swan event in which Tesla goes bankrupt.
The resulting probabilities of the ten different scenarios and their corresponding price targets are shown below.[3]
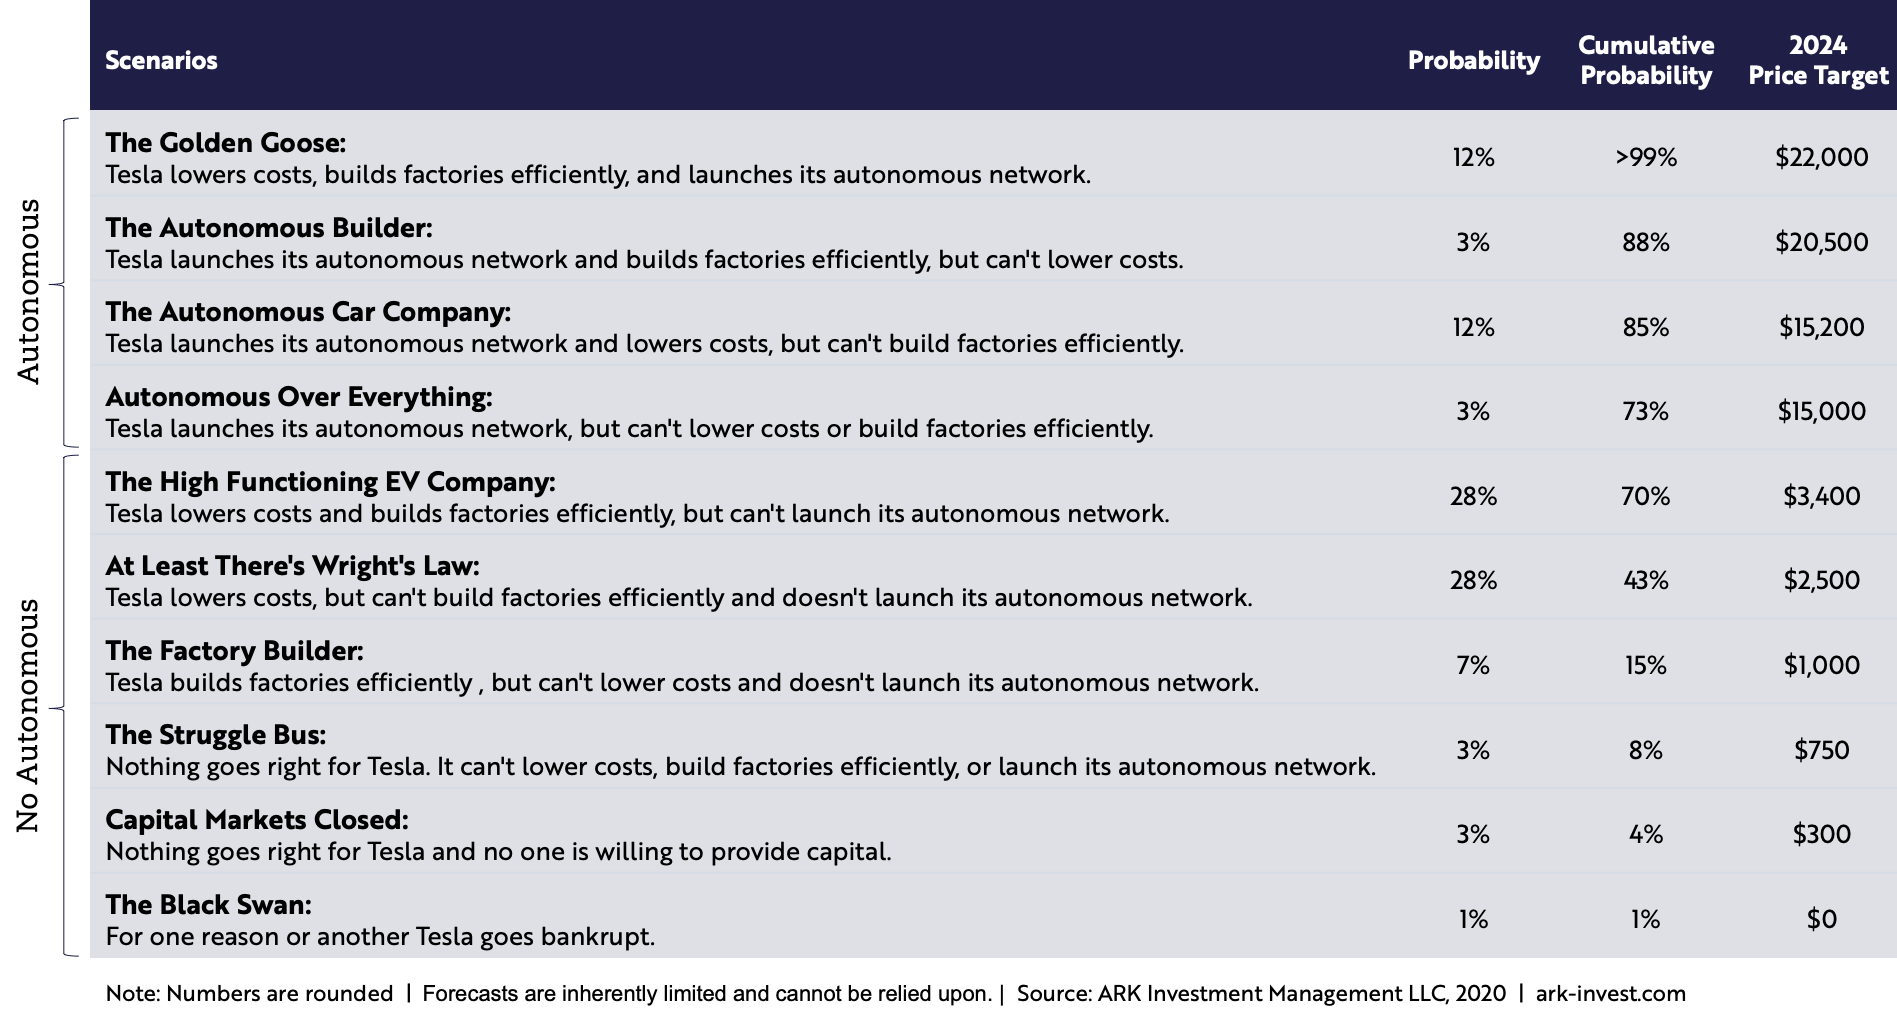
In all cases, except those in which it either is denied access to the capital markets or is bankrupt, we assume that Tesla issues $10 billion in equity capital to scale production at an accelerated rate and capitalize on its competitive advantages. We also anticipate that Tesla will issue incremental debt—tens of billions of dollars in some cases— to scale production and that the issuance will be governed by its profitability and collateralized by its fixed assets.
Based on this probability matrix, our bear case implies that Tesla will sell 3.2 million vehicles in 2024, cutting its share of total EV sales roughly in half compared to today’s levels.[4] Our bull case implies that Tesla will maintain its roughly 18% market share, and that a substantial percentage of its fleet will generate high-margin robotaxi platform fees.
| Bear Case | Bull Case | |
| Cars Sold (millions) | 3.2 | 7.1 |
| Average Selling Price (ASP) | $52,000 | $36,000 |
| Electric Vehicle Revenue (billions) | $166 | $256 |
| Robotaxi revenue (net, billions) | $0 | $351 |
| Gross Margin | 33% | 57% |
| EBITDA Margin | 17% | 33% |
| Enterprise Value/EBITDA | 10.9 | 13.9 |
| Market Cap (billions) | $300 | $3,000 |
| Share Price | $1,500 | $15,000 |
| Free Cash Flow Yield | 7.3% | 4.9% |
While these assumptions might seem far-fetched, please consider the following research:
Gross Margins and Wright’s Law [5]
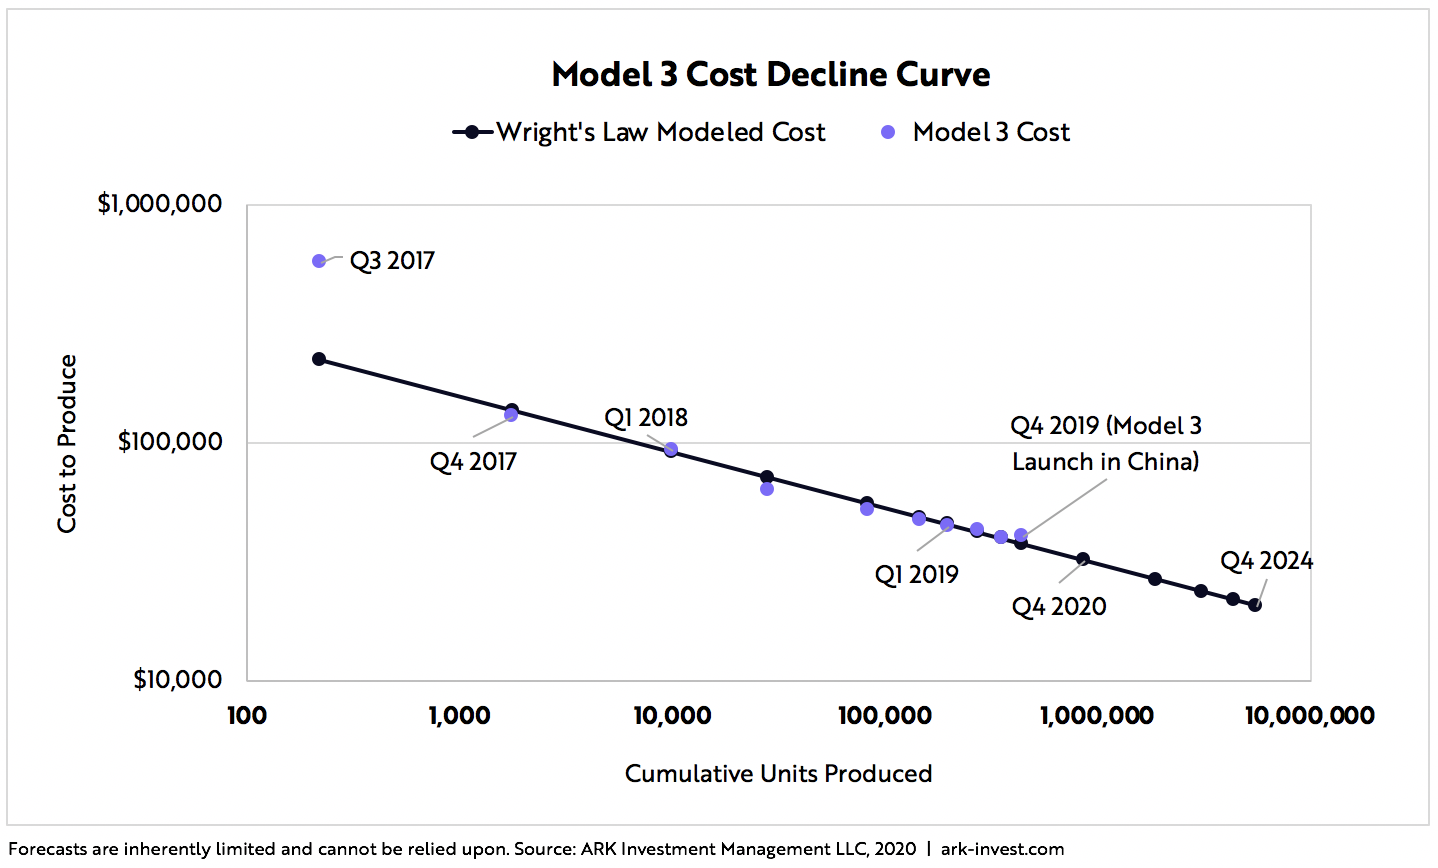
We believe that gross margins are key to Tesla’s viability and value. In the fourth quarter of 2019 Tesla reported auto gross margins of 20.9% excluding regulatory credits.[6] Based on Wright’s Law and expressed in ARK’s model, Tesla’s auto gross margins could approach 40% in 2024,[7] though they are unlikely to increase in a straight line as new models launch and production scales.
Wright’s Law has forecast cost declines successfully in more than 60 technologies ranging from solar power to televisions, and from semiconductors to ovens.[8] As shown below, Tesla’s Model 3 already has demonstrated cost declines in line with Wright’s Law.
The auto industry has scaled in line with the cost declines predicted by Wright’s Law for more than a century. As shown below, Ford’s costs have tracked the declines predicted by Wright’s Law since 1903.
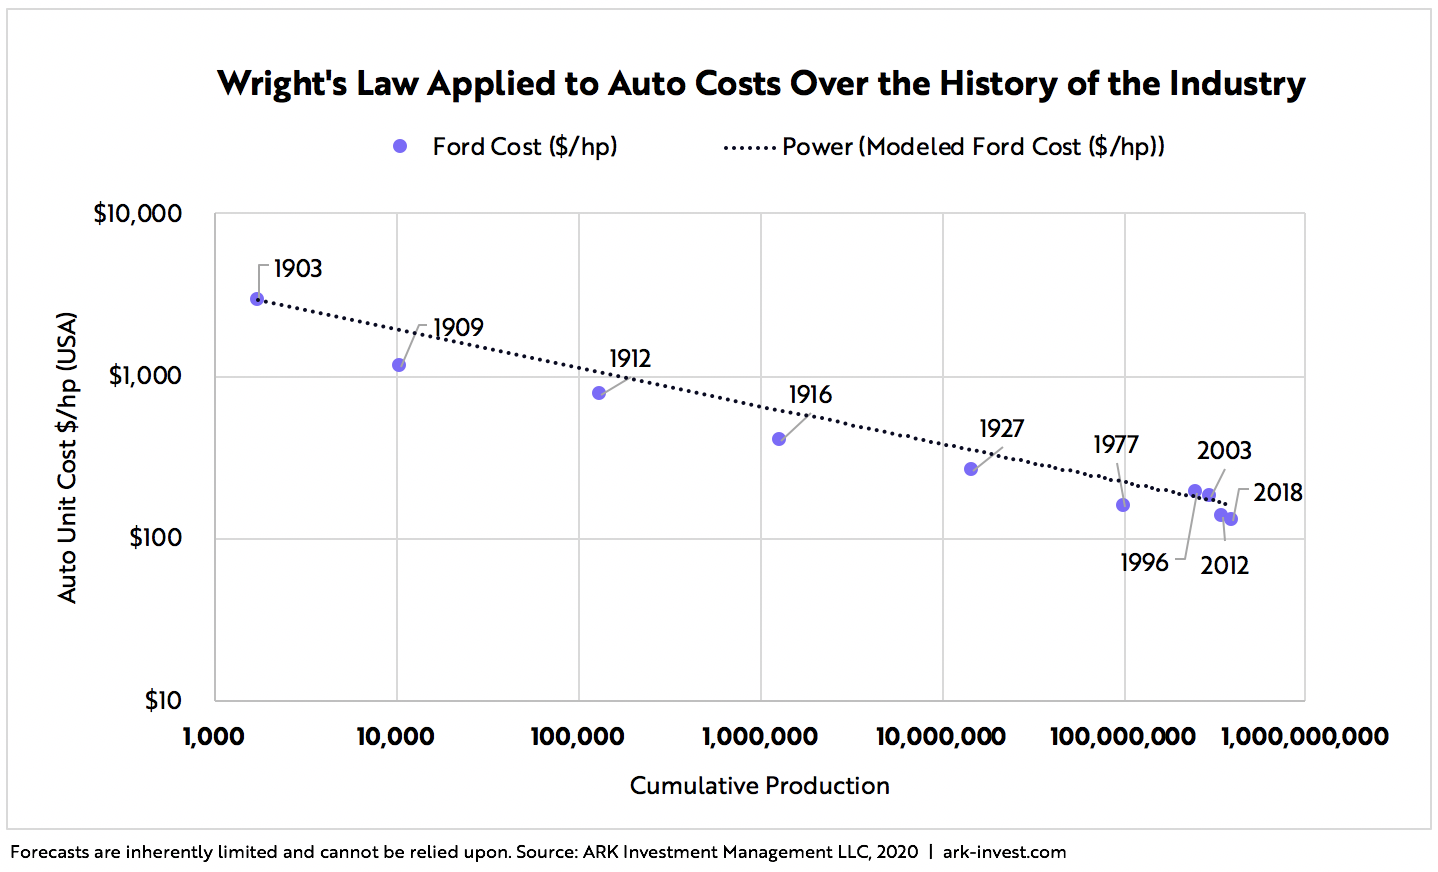
While Ford’s costs appear to have stabilized, Tesla’s costs should continue to decline during the next five years because the internal combustion engine is a technology far more mature than is the lithium-ion battery. A mature technology seems to stop declining in cost because of how long it takes to double production from a large base. Globally, automakers have manufactured roughly 5.4 million EVs to date, less than 1% of the 2.6 billion internal combustion engine (ICE) vehicles ever produced.[9] Even if the production of ICE vehicles were to stabilize at roughly 90 million vehicles annually, a cumulative doubling would take 29 years, much longer than the roughly one to two years likely for a cumulative doubling in EV production.
In addition to our Wright’s Law analysis for vehicle production costs, ARK’s model drops the average selling price (ASP) for EVs selling at higher volumes. In the bull case, ARK estimates that Tesla will be able to attain only 15-20% of the addressable market for each model. At their peak, the combined sales of the Model S and X commanded roughly 20% of the premium vehicle segment.
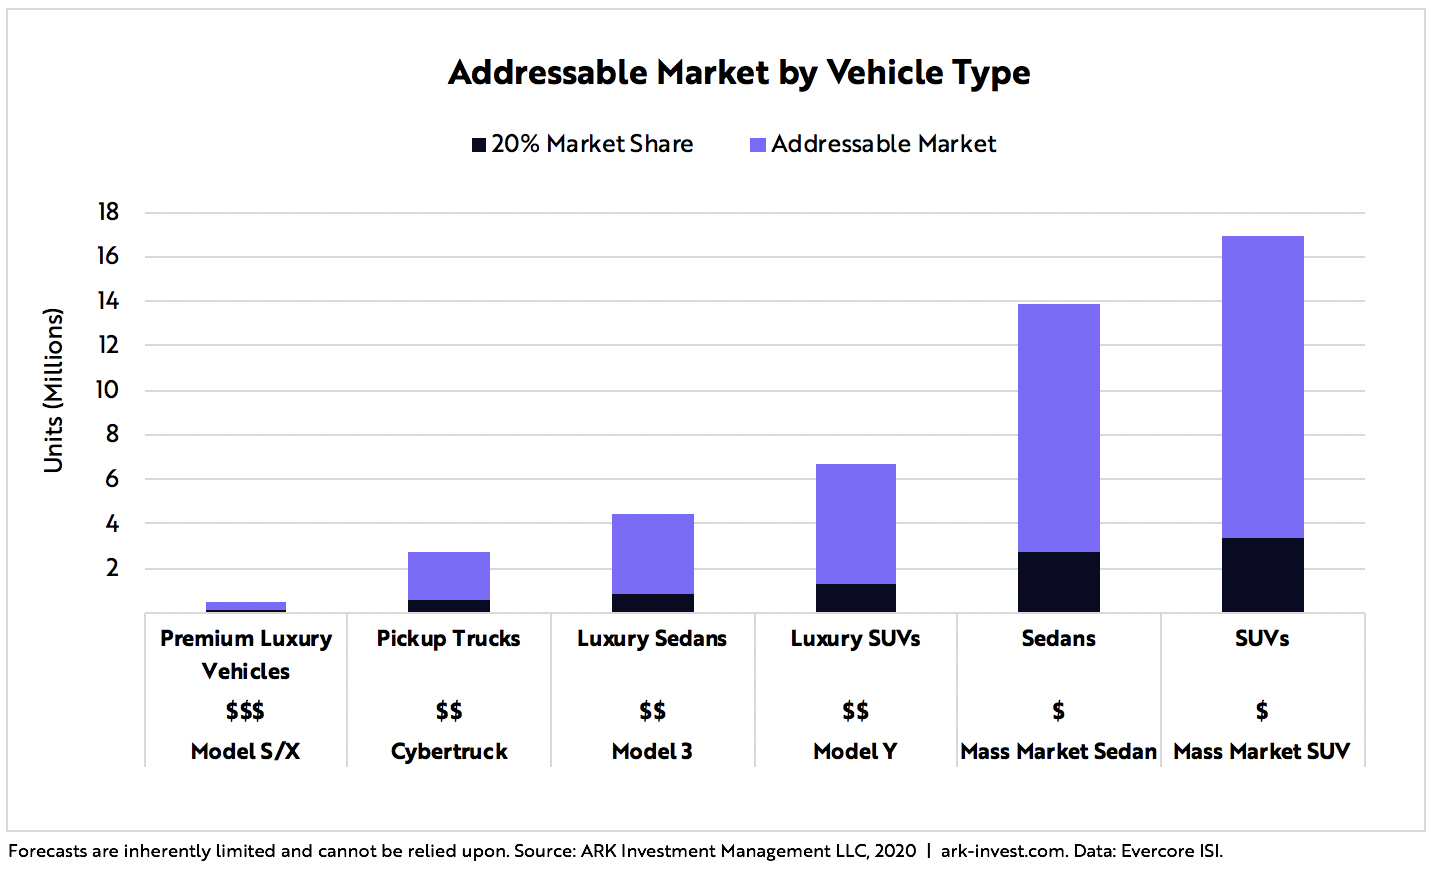
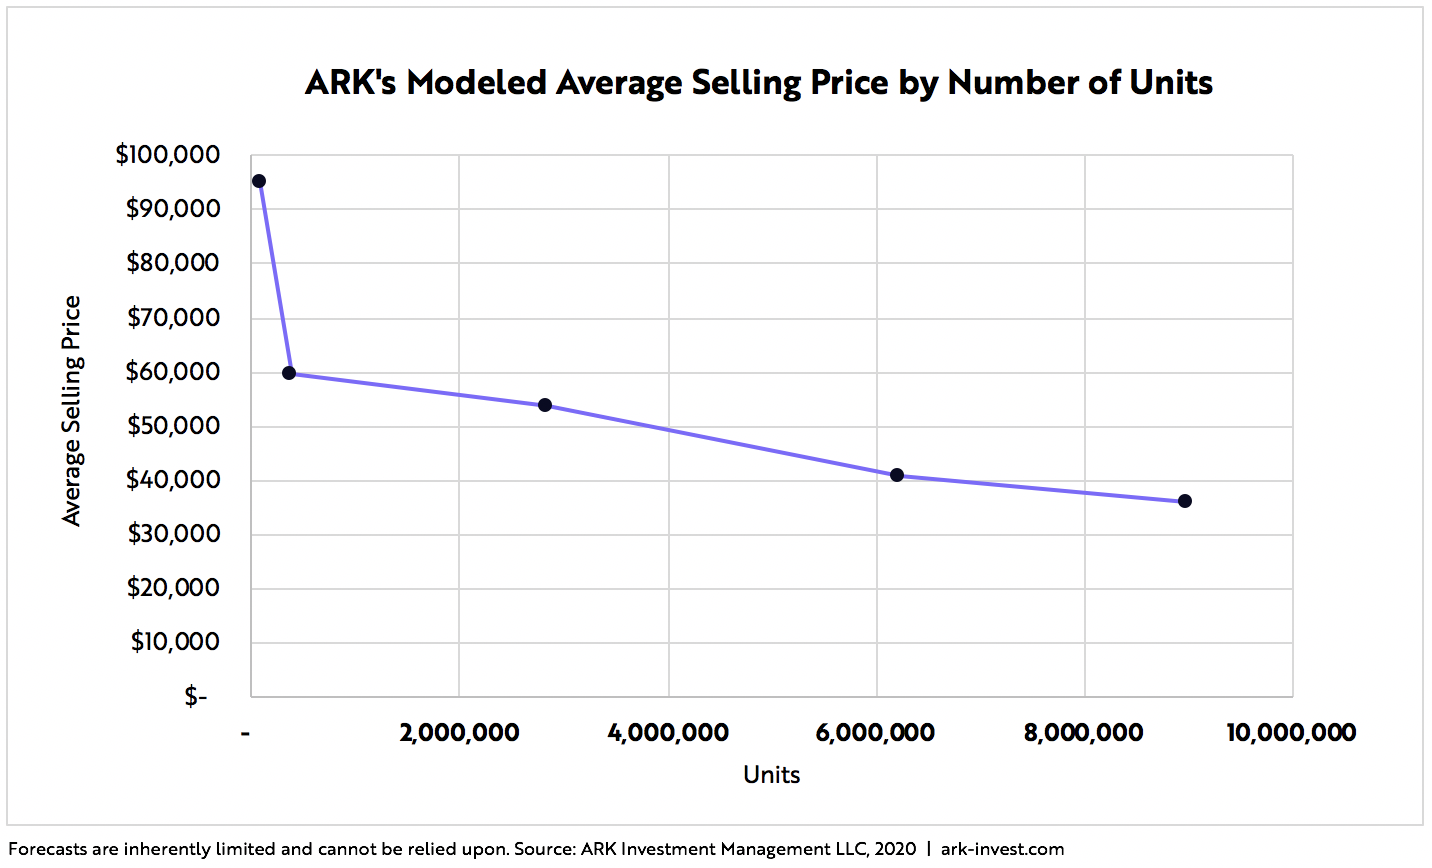
As shown below, we assume average selling prices (ASPs) must decline to access greater levels of demand. We believe that assumption is conservative, especially given the fact that Tesla’s next two vehicles, the Model Y and Cybertruck, have an ASP higher than the Model 3.[10] In our model, we adjust ASPs accordingly.
ARK’s High-End Gross Margin Scenario:
Despite the assumption of a steep decline in average selling prices, if costs were to fall in line with Wright’s Law, ARK’s model suggests that Tesla’s auto gross margin could approach 40% in the next five years.
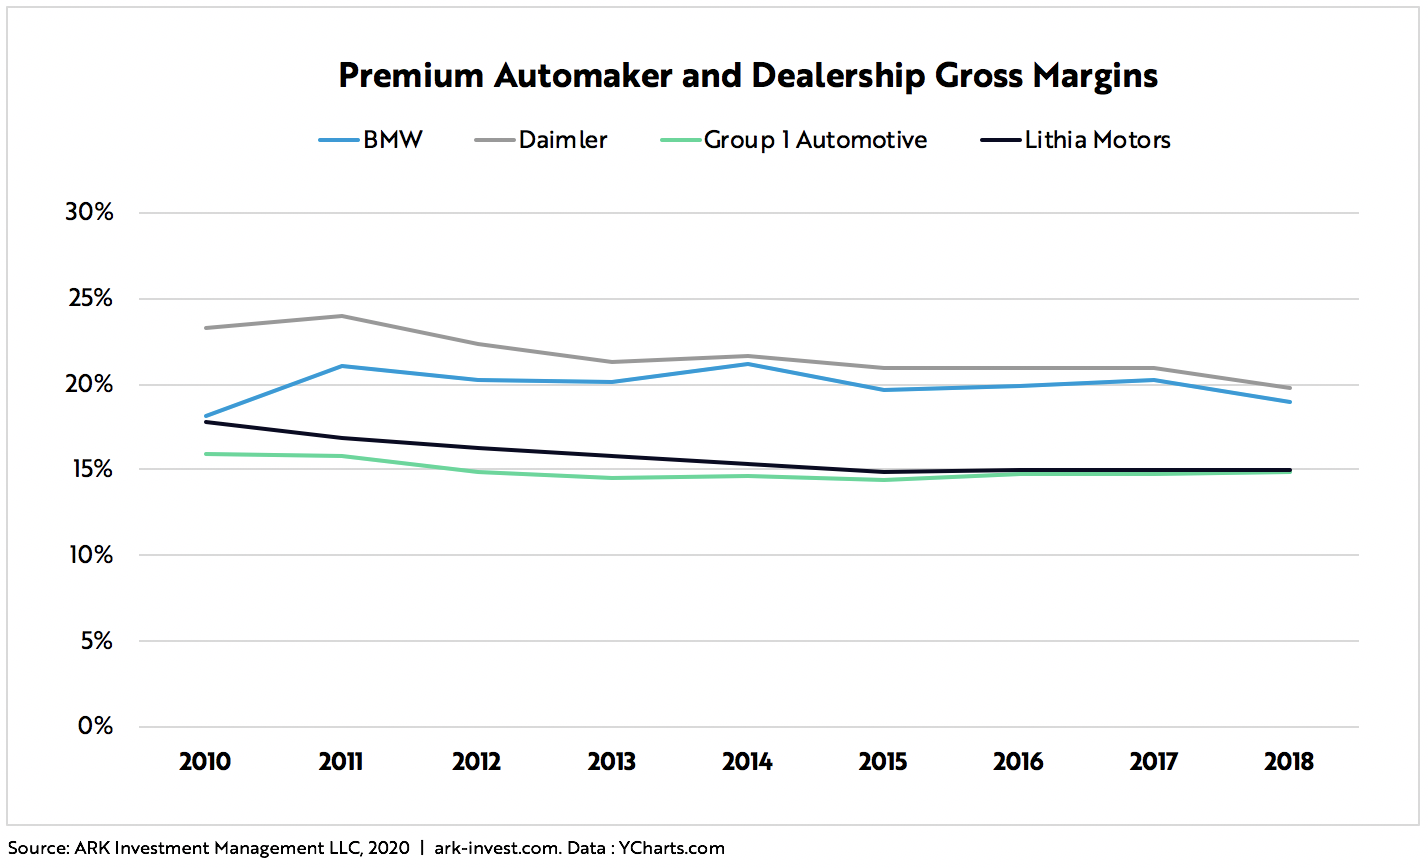
ARK’s Low-End Gross Margin Scenario:
According to our model, if its costs do not conform to Wright’s Law, Tesla’s gross margins should increase modestly to 25% by 2024, consistent with the average margins for luxury automakers when adjusted for ownership of distribution and service centers. As shown below, Daimler and BMW have gross margins of roughly 19%, while national car dealerships have gross margins of roughly 15%, a third of which typically is from services.
Capital Efficiency
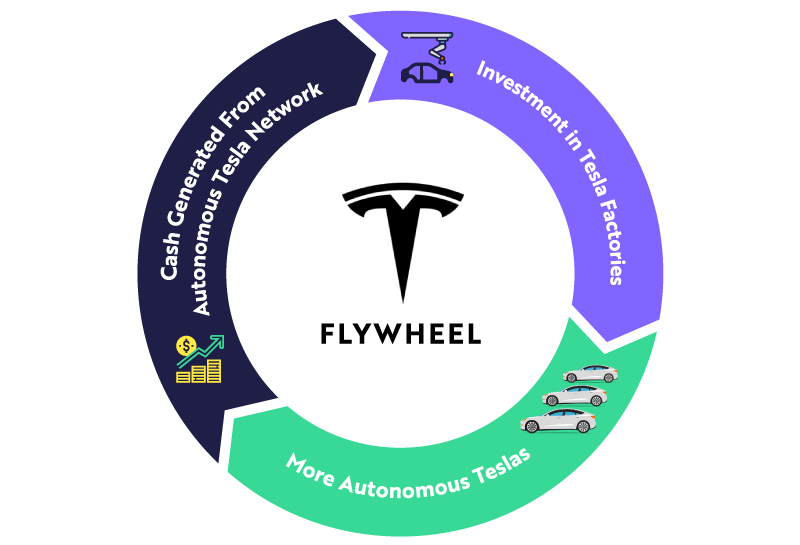
Capital efficiency sparks and accelerates the Tesla flywheel. If expanding capacity is prohibitively expensive, then the cumulative doubling of production – necessary to lower costs, generate cash, and reinvest in expanding production – becomes uneconomic. If Tesla were to be capital efficient, then it could expand production rapidly and affordably, lowering unit costs, increasing returns on invested capital, generating cash for future factories, and attracting more capital.
ARK assumes that Tesla will be more capital efficient than traditional automakers. The amount of capital required to produce a car powered by an internal combustion engine in the US has been rising steadily. In the last five years or so, the auto industry has invested more than $14,000 in fixed assets for every car produced per year.[11]
With a fraction of the moving parts, electric vehicles should be manufactured much more efficiently than gas powered cars. Indeed, Ford and other automakers have suggested that EVs could be produced at 50% of the capital investment necessary for gas powered vehicles. A straightforward calculation – 50% of $14,000 – suggests that an EV factory could be built for $7,000 per unit volume of capacity.
ARK’s High-End Capital Efficiency Scenario:
In our capital efficient case, we assume Tesla will be able to build factories for $11,000 per unit volume of capacity. For context, Tesla confirmed that $1.6 billion in financing was necessary for its Shanghai factory, which will have an initial capacity of 150,000 vehicles. If $1.6 billion were to net 150,000 vehicles, the cost per unit of initial capacity would be roughly $10,700, before increasing productivity.
ARK’s Low-End Capital Efficiency Scenario:
According to our model, if it were not capital efficient, Tesla’s cost per unit of capacity would be $16,000, or $2,000 higher than the gas-powered auto industry average today.
Autonomous Execution
A fully autonomous taxi network could break the mold of a traditional automotive manufacturer’s business model completely. Tesla could shift from a model of one-time transactions at hardware-like margins to a model of recurring transactions at software-like margins, charging passengers per mile and taking a platform fee.
ARK’s High-End Autonomous Execution Scenario:
Initially, Tesla could set rates comparable to the $2.50 per mile that Uber and Lyft charge today, dropping them to $1 per mile in 2023. We model that Tesla will take a 50% cut of gross revenues from autonomous taxi networks,[12] much higher than the 20-30% cut that Uber and Lyft enjoy today, based on the additional convenience, improved safety, and cost savings, as well as ARK’s analysis of platform fees in other markets. We also assume that its autonomous taxi service will begin in 2021, one year after Elon Musk has predicted the service will be available, regulatory approval permitting, with just 2% of eligible Tesla vehicles on the network in its first year.[13]
In previous versions of our valuation model, ARK assumed that the cash generated from autonomous taxis would build on Tesla’s balance sheet. In this version of the model, ARK assumes that Tesla will invest any incremental cash in additional factories to scale EV production capacity and “accelerate the world’s transition to sustainable energy,” consistent with its mission statement.
ARK’s Low-End Autonomous Execution Scenario:
If an autonomous taxi network never launches, clearly it will generate no revenues.
As shown below, the full picture of the flywheel should become clear. An autonomous taxi network should provide Tesla with capital to invest in factories to produce more vehicles, which should lower production costs and expand Tesla’s autonomous fleet.
Now that you’ve made it this far, we would like to hear your opinion. What do you think the odds are of Tesla achieving the high end or the low end of each of our independent variables? We invite you to generate your own expected value for Tesla. If you don’t believe in autonomous, but do believe in Wright’s Law, soon we will upload a probability distribution sheet to GitHub that will allow you to plug in your own expectations for each of those critical variables. Staying true to ARK’s open source ethos, within the next few weeks we also will update an extract of this new model that incorporates capital efficiency and Wright’s Law as key drivers.[14]
Related Research