Actively Managed Equity
 Overview: All Strategies
 Investor Resources
 Indexed Equity
 Private Equity
 Digital Assets
 Invest In The Future Today
 Take Advantage Of Market Inefficiencies
 Make The World A Better Place
 Articles
 Podcasts
 White Papers
 Newsletters
 Videos
 Big Ideas 2024
On-Chain Data: A New Framework to Evaluate Bitcoin


This article was co-authored by David Puell (@kenoshaking). David is a full-time cryptocurrency on-chain analyst and market researcher. Best known for pioneering the emergent field of on-chain analysis, David has created original Bitcoin valuation metrics, including the MVRV Ratio and the Puell Multiple.
Bitcoin’s inability to fit neatly within the framework associated with traditional asset classes has dissuaded institutional investors from adopting it. We believe that instead of considering its unique attributes, skeptical investors have concluded that Bitcoin, the blockchain, and bitcoin, the cryptocurrency, cannot be analyzed fundamentally.
In our view, investors increasingly will appreciate Bitcoin’s investment merits through the lens of a completely new framework. While conventional analytical frameworks are not suitable, Bitcoin offers a unique set of tools that investors can leverage to assess its fundamentals.
In the same way that a government statistical agency publishes data about a country’s population and economy, or a public company publishes quarterly financial statements disclosing growth rates and earnings, Bitcoin provides a real-time, global ledger that publishes data about the network’s activity and inner economics. In the absence of central control, Bitcoin’s blockchain provides open-source data, its integrity a function of the network’s transparency.
Investors Can Analyze Open-Source Data and Assess Bitcoin’s Fundamentals
As we will explore in this three-part blog series, market participants can source on-chain data to analyze Bitcoin in more depth than is possible with any other traditional asset. We categorize the depth of analysis with a three-layered pyramid, with lower layers serving as the building blocks for higher layers, as shown below.
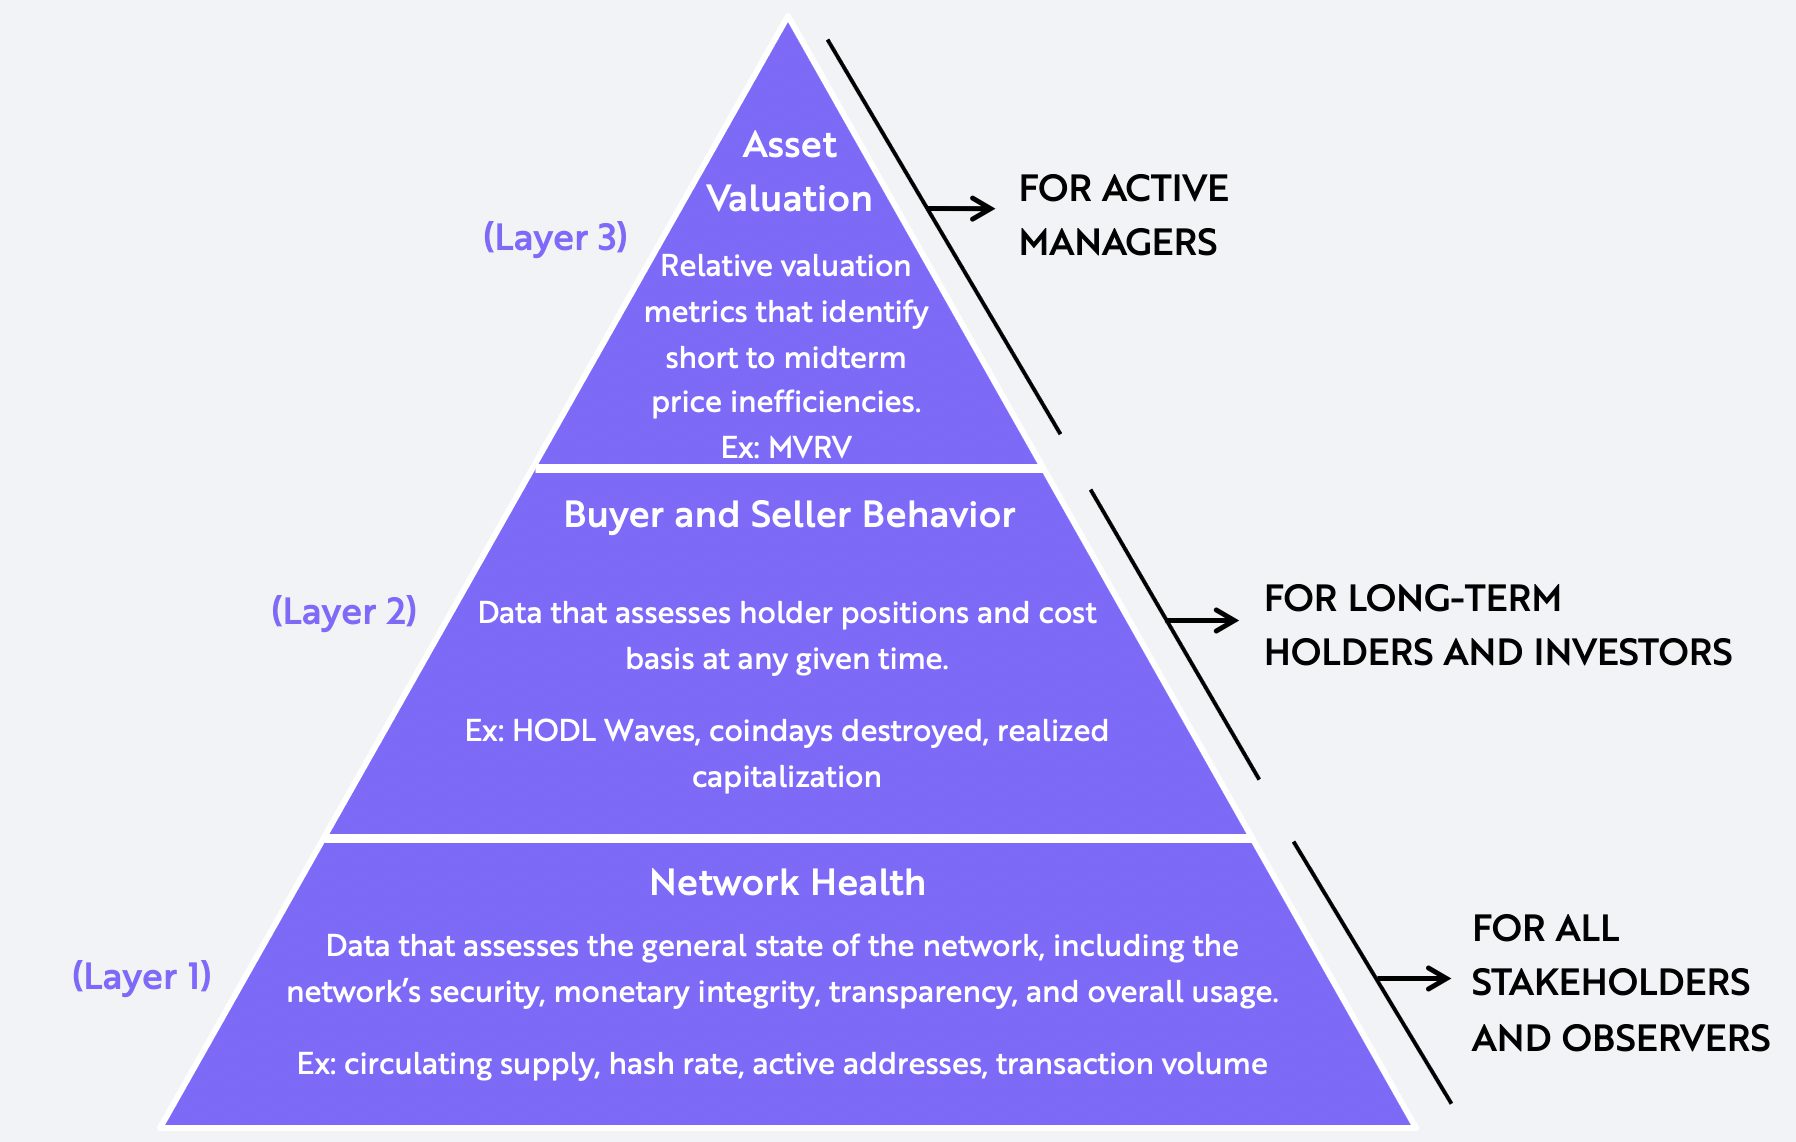
Note: The Market Value to Realized Value (MVRV) ratio is a long-term metric used to assess bitcoin’s market cycles over the long term. HODL is a term derived from a misspelling of “hold” that refers to buy-and-hold strategies in the context of bitcoin and other cryptocurrencies.
Source: ARK Investment Management LLC, 2020
Before delving into the details, the data in the bottom layer of the pyramid assesses the general health of the network: network security, monetary integrity, transparency, and usage. Accessed by any blockchain “search-engine”, the data in this layer is raw and straight-forward, requiring little to no manipulation. Relevant to all market observers, it offers a basic “fact sheet” about the network. In this blog, we will explore this data layer in detail after summarizing the other two layers.
The data in the middle layer delves deeper: by wallet address, it discloses each holder’s positions and cost bases any time of the day. In the long-term bitcoin’s price might react more to the raw network health data in layer 1, but in the short- to medium-term the behavior of buyers and sellers can help investors surface inefficiencies in the pricing and valuation of this non-productive asset.
Finally, in the top layer is data leveraging off the two lower layers, providing relative valuation metrics that identify short- to mid-term inefficiencies in bitcoin’s price. Particularly useful for active managers, the top data layer provides buy and sell signals in the crypto market much like relative valuation multiples such as EV-to-EBITDA in the public equities market.
In this three-part blog series, in collaboration with Glassnode, we illustrate how on-chain data offers a new framework to analyze emerging monetary assets like bitcoin. As institutional investors gain exposure to bitcoin, we believe that the network’s three data layers will enhance their understanding of and confidence in its underlying fundamentals. Throughout this series, we aim to unpack the power of on-chain data and describe the tools and techniques that should enable investors to turn raw open-source data into actionable investment decisions.
While we could extend this framework and analysis to other cryptocurrencies that run on open-source software, the focus of this series is on bitcoin and the Bitcoin network. Important to note, no other network rivals Bitcoin’s in transparency which, in our view, makes it the most “analyzable” and fundamentally-sound network.
Why Bitcoin?
Not all blockchains are created equal. The more open and transparent a blockchain is, the easier market participants can analyze its underlying fundamentals. The most useful public blockchains offer easy-to-access tools to audit their networks. Today, any individual can download a Bitcoin client, install a node, and extract insightful network data with relatively low barriers to entry. We believe Bitcoin’s auditability, openness, and transparency stem from three of the network’s characteristics:
- Bitcoin Has A Simple Accounting System: In contrast to traditional account-based accounting systems, Bitcoin’s UTXO-based accounting system makes tracking supply and auditing monetary policy simple.
- Bitcoin’s Code is Verified: The implementation of Bitcoin’s protocol lives in code that has been scrutinized more than any other open-source software code.
- Bitcoin Nodes Are Efficient: Bitcoin nodes, or volunteer computers running software to verify the network’s integrity, are much more cost-efficient than alternative cryptocurrency network nodes.
Layer 1: Assessing the Health of The Bitcoin Network
Investors can monitor the health of the Bitcoin network in real time by extracting raw open-source data from Bitcoin nodes. In the table below, we describe and provide metrics for three ways to assess the health of the network.
Table 1: Assessing the Health of The Bitcoin Network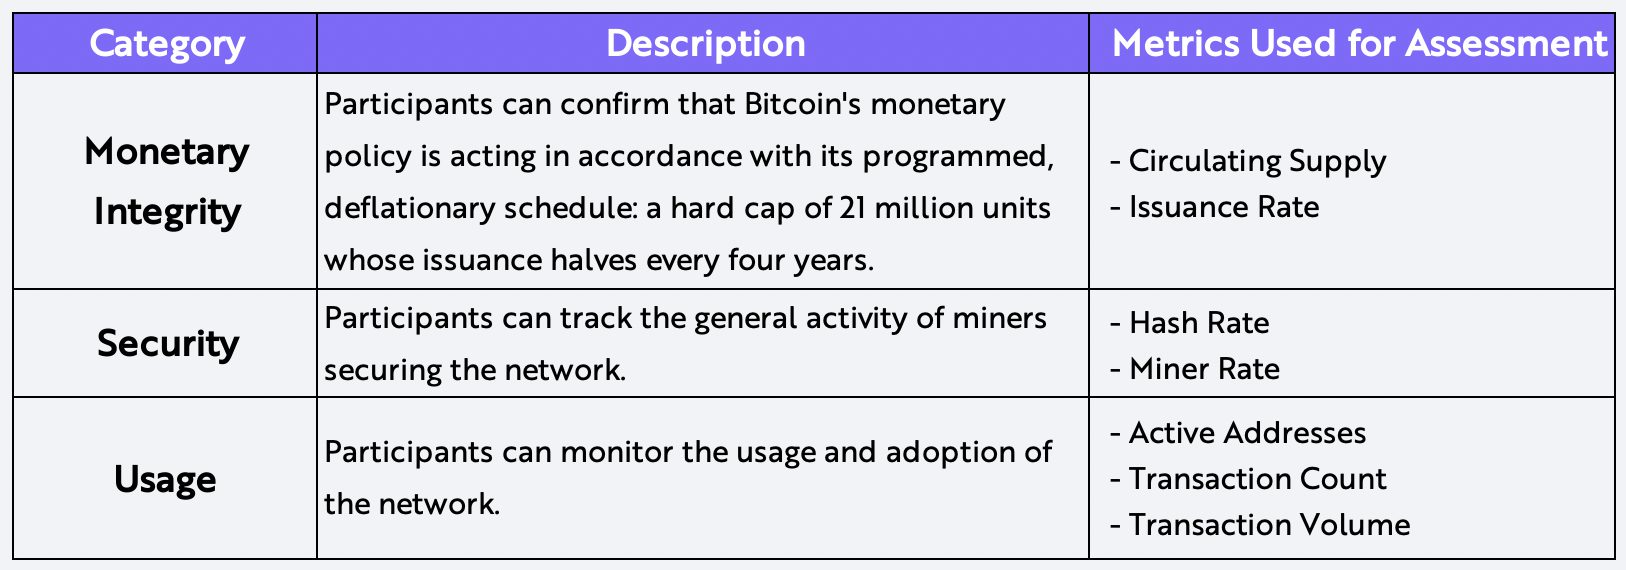
Source: ARK Investment Management LLC, 2020
I. Monetary Integrity
The Bitcoin protocol has ensured monetary integrity by giving analysts and investors the ability to track bitcoin’s total circulating supply and daily issuance, both shown in the charts below. Total circulating supply is a function of historical monetary policy and daily issuance current monetary policy. From its inception, monetary policy has been pre-determined and encoded in the Bitcoin protocol, making it completely predictable and verifiable. Buttressed by a robust system of checks and balances, Bitcoin’s strict adherence to a rules-based monetary policy highlights its integrity.
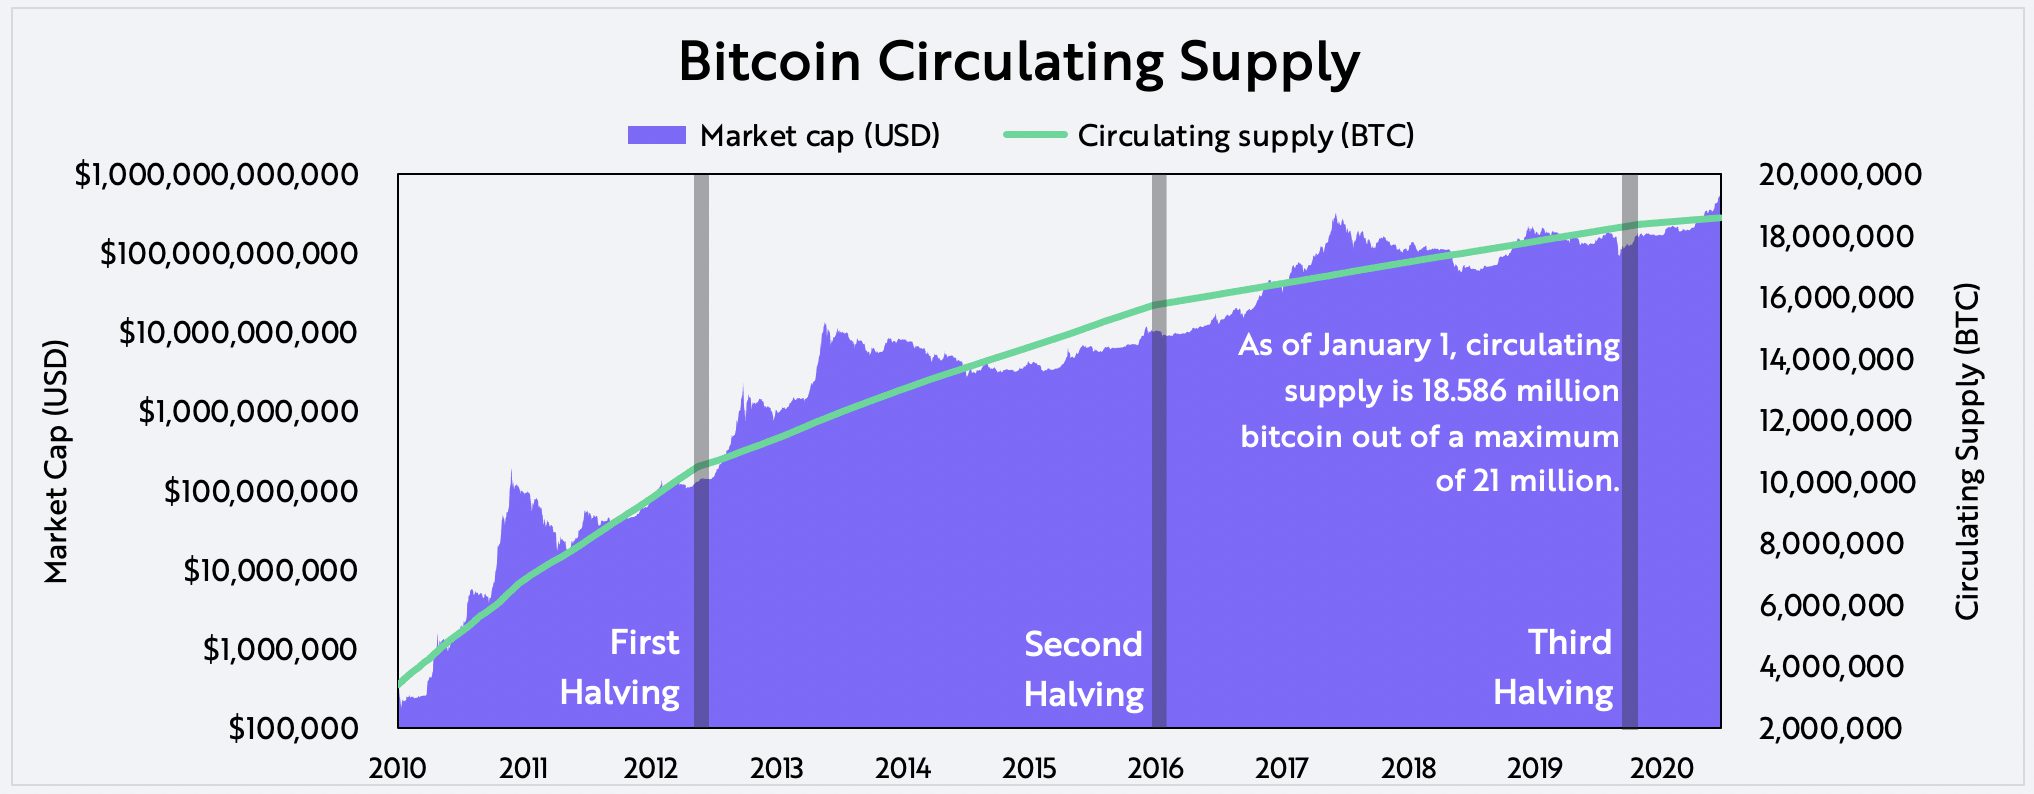
For informational purposes only and should not be considered investment advice, or a recommendation to buy, sell or hold any particular security or cryptocurrency.
Source: ARK Investment Management LLC, Glassnode
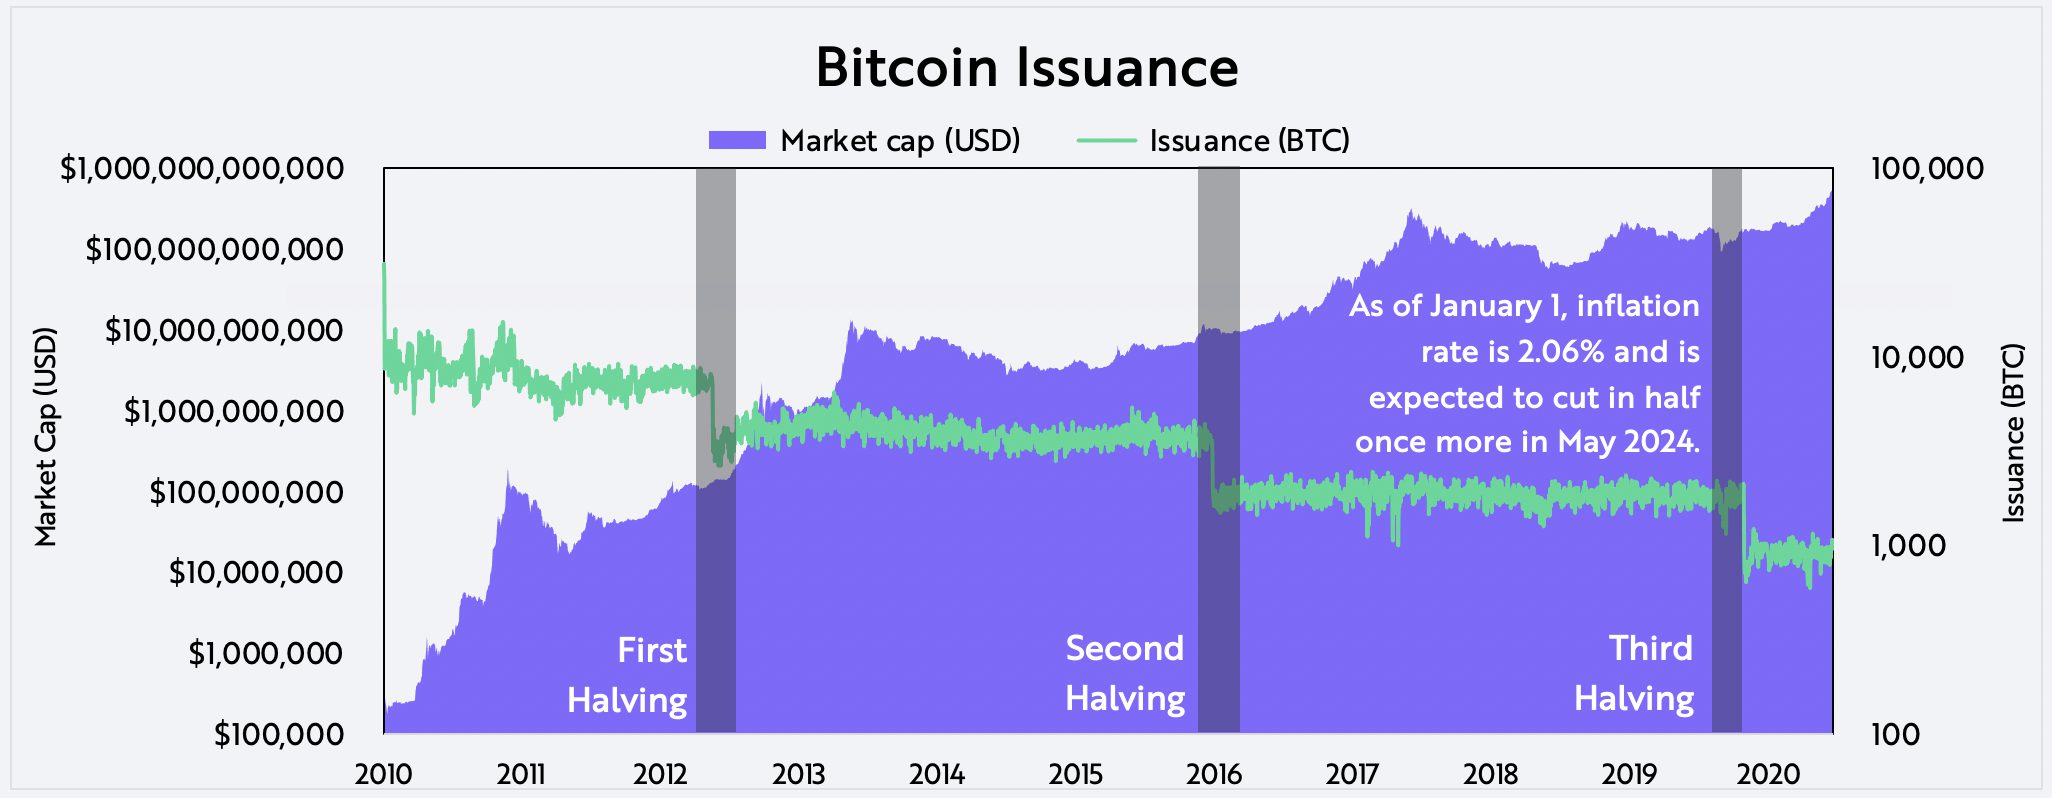
For informational purposes only and should not be considered investment advice, or a recommendation to buy, sell or hold any particular security or cryptocurrency.
Source: ARK Investment Management LLC, Glassnode
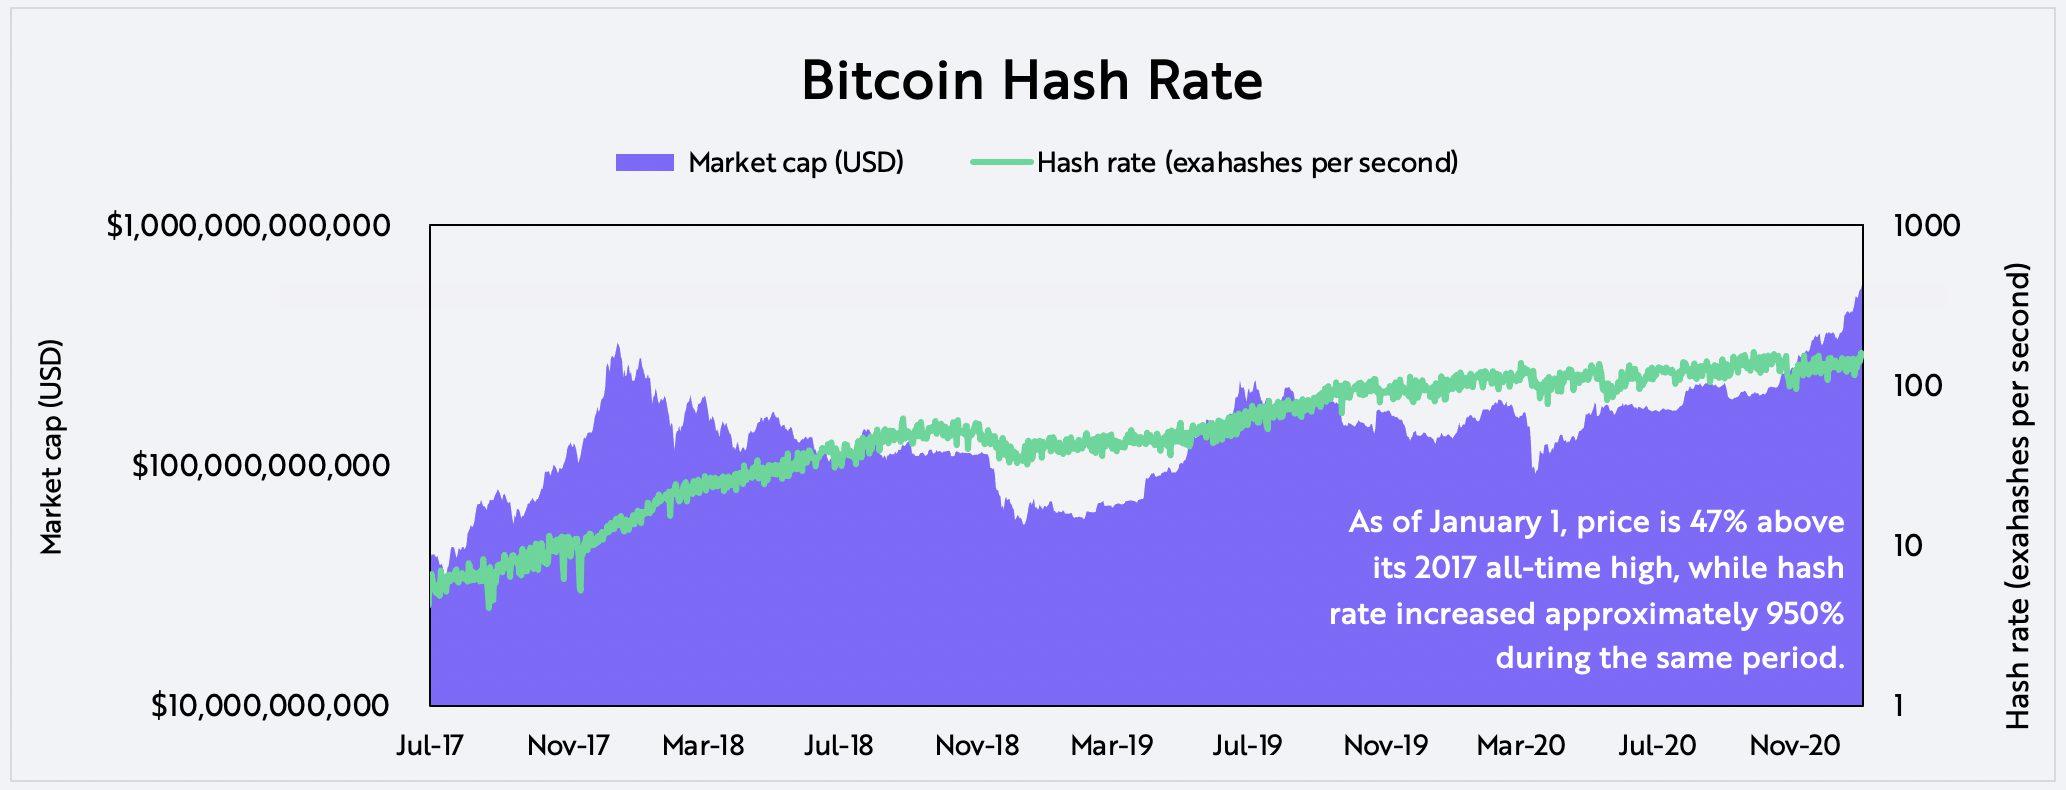
II. Security
Bitcoin’s security is guaranteed by miners, who ensure transactions are verified and irreversible. Hash rate, as shown below, measures the processing power miners use to secure the network from attacks. All else equal, rising hash rate levels increase the security of the network.
For informational purposes only and should not be considered investment advice, or a recommendation to buy, sell or hold any particular security or cryptocurrency.
Source: ARK Investment Management LLC, Glassnode
Hash rate has increased nearly an order of magnitude every two years for the last six years, as shown above, three times faster than the rise in bitcoin’s price during the last five years. Supporting the dramatic rise in hash rate are advances in hardware and miners’ willingness to invest based on the expectation of bitcoin’s price appreciation over time. Interestingly, only in the past few months has the price of bitcoin surpassed its 2017 high during which time its hash rate has increased by 950%.
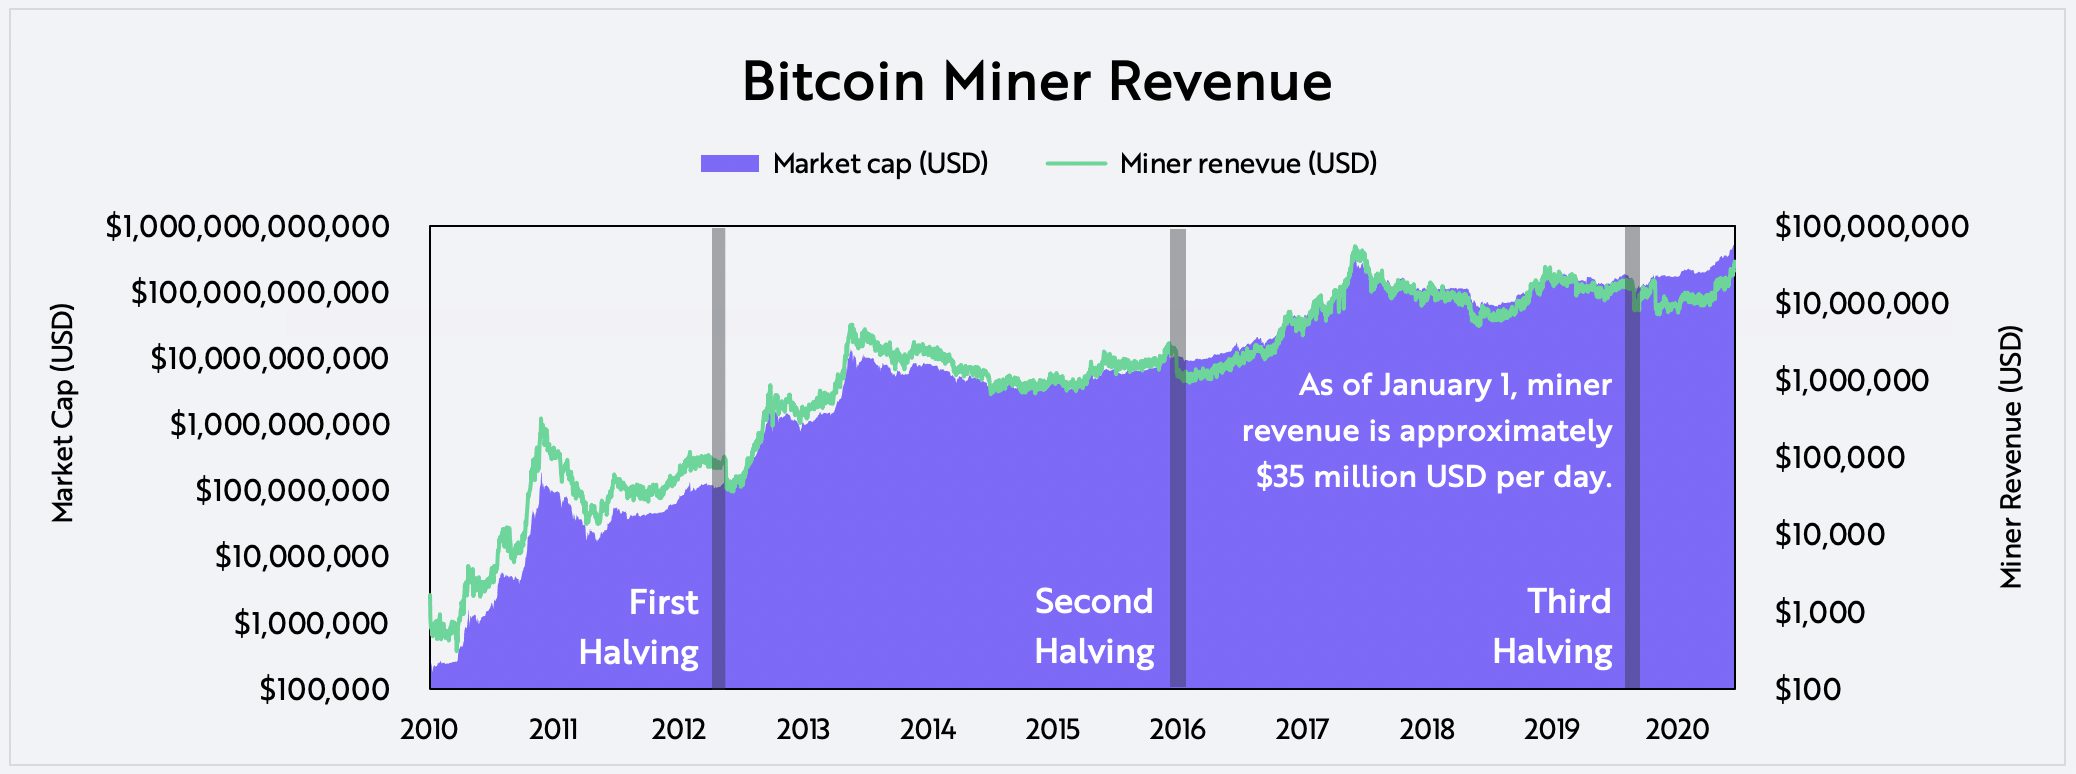
Miner revenue, the sum of newly minted bitcoin and transaction fees, also is a measure of miner investment in securing the network. Since inception, miners have generated revenue of over 18.5 million bitcoin, roughly $600 billion at current prices, as shown below.
For informational purposes only and should not be considered investment advice, or a recommendation to buy, sell or hold any particular security or cryptocurrency.
Source: ARK Investment Management LLC, Glassnode
III. Usage
Investors can monitor Bitcoin’s network activity and usage by tracking the number of active addresses, a proxy for user adoption, in addition to transaction volume, a proxy for economic activity.
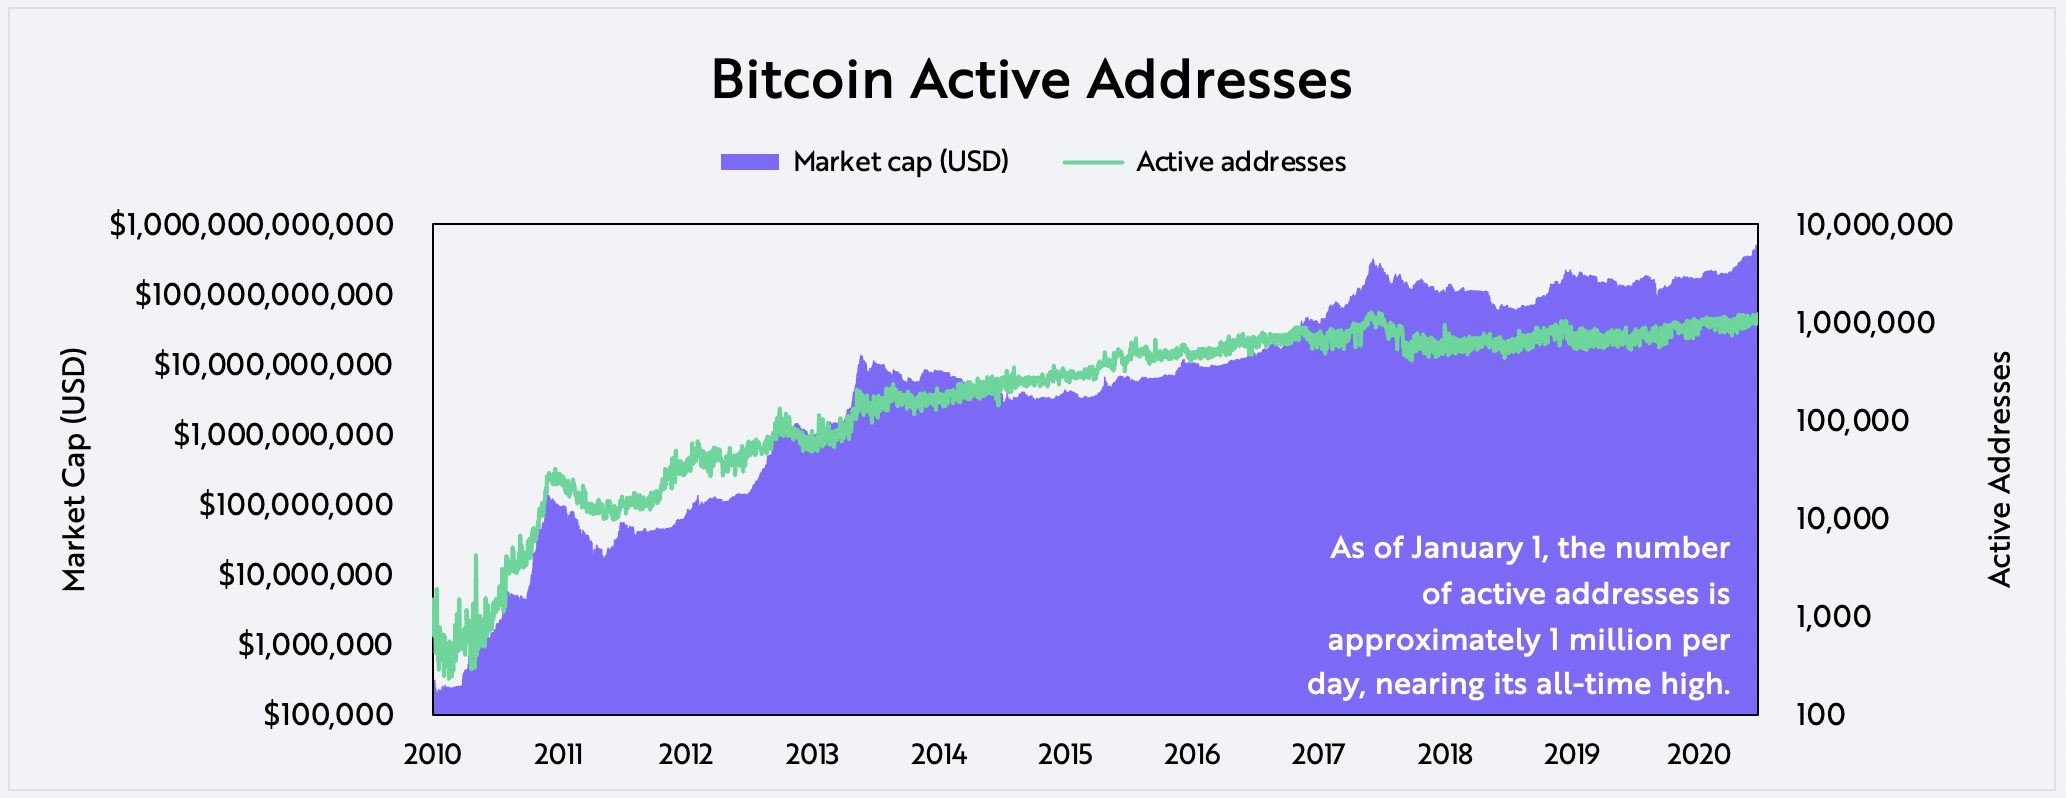
Active Addresses
Thanks to the transparency of the Bitcoin network, market participants can monitor its activity down to the level of active addresses. While not a direct proxy for the number of users, active addresses show the number of unique addresses active on the network on any given day. Single addresses can represent either individuals or exchanges and mining operations. The number of daily active Bitcoin addresses exceeds 1 million,[1] its increase correlating positively with bitcoin’s price over time.
For informational purposes only and should not be considered investment advice, or a recommendation to buy, sell or hold any particular security or cryptocurrency.
Source: ARK Investment Management LLC, Glassnode
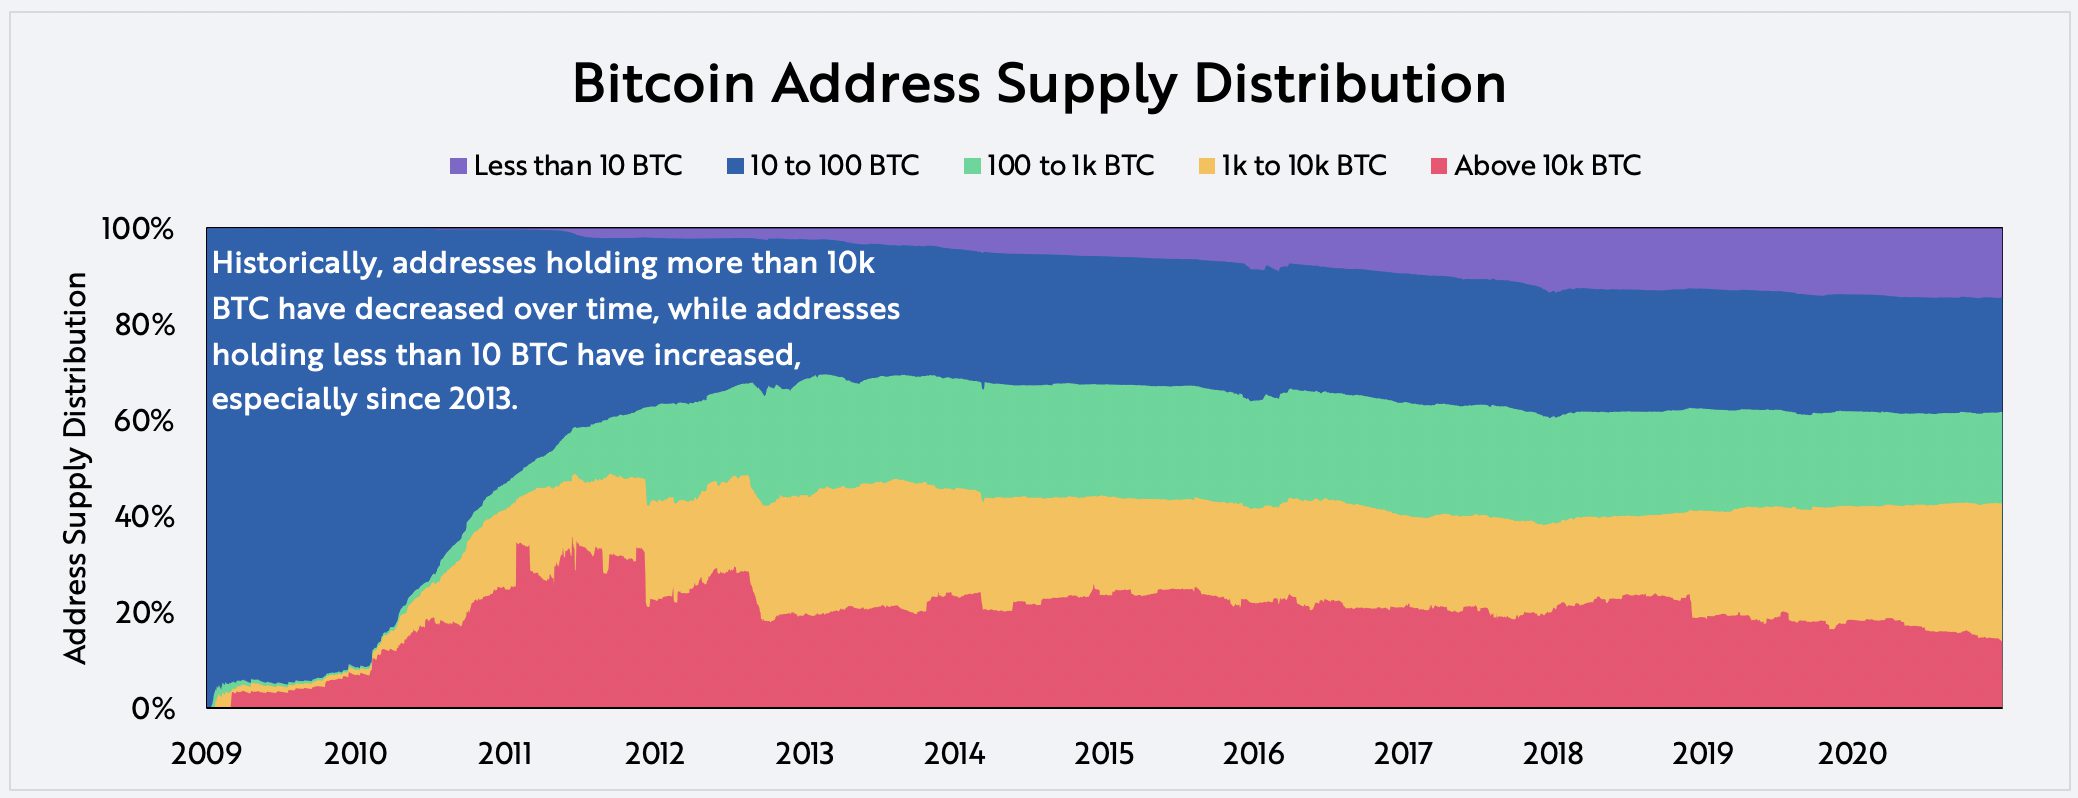
A more granular breakdown of active addresses can capture the distribution of bitcoin in each address over time. As shown below, the share of bitcoin in addresses holding more than 10,000 bitcoin has decreased over time, while the share holding fewer than 10 has increased. In other words, it appears the wealth associated with bitcoin is decentralizing, broadening out.
For informational purposes only and should not be considered investment advice, or a recommendation to buy, sell or hold any particular security or cryptocurrency.
Source: ARK Investment Management LLC, Glassnode
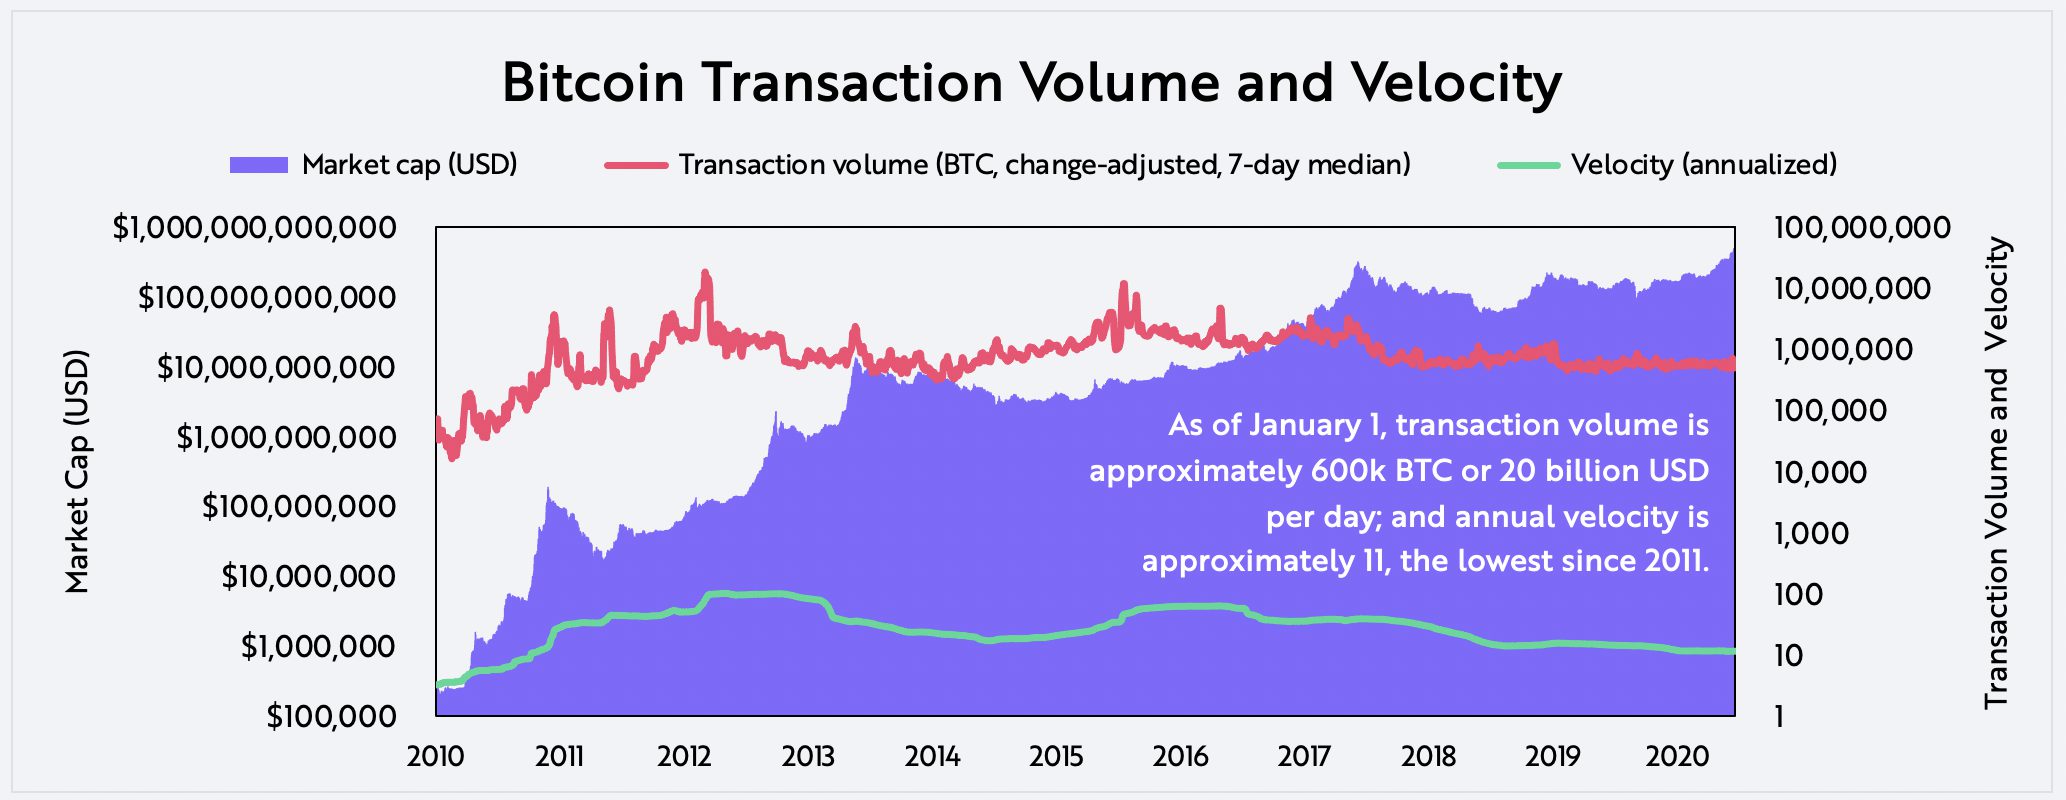
Transaction Volume
Since its creation, Bitcoin has settled approximately $10 trillion in transactions, highlighting its ability to serve as a global settlement system. When divided by circulating supply, transaction volume can provide some insight into bitcoin’s annualized velocity, as shown below. During the past eight years, the velocity of bitcoin has dropped to a level not seen since 2011, perhaps for several reasons: investors could be hoarding it or could have lost it, and/or transaction activity could be moving off-chain.
For informational purposes only and should not be considered investment advice, or a recommendation to buy, sell or hold any particular security or cryptocurrency.
Source: ARK Investment Management LLC, Glassnode
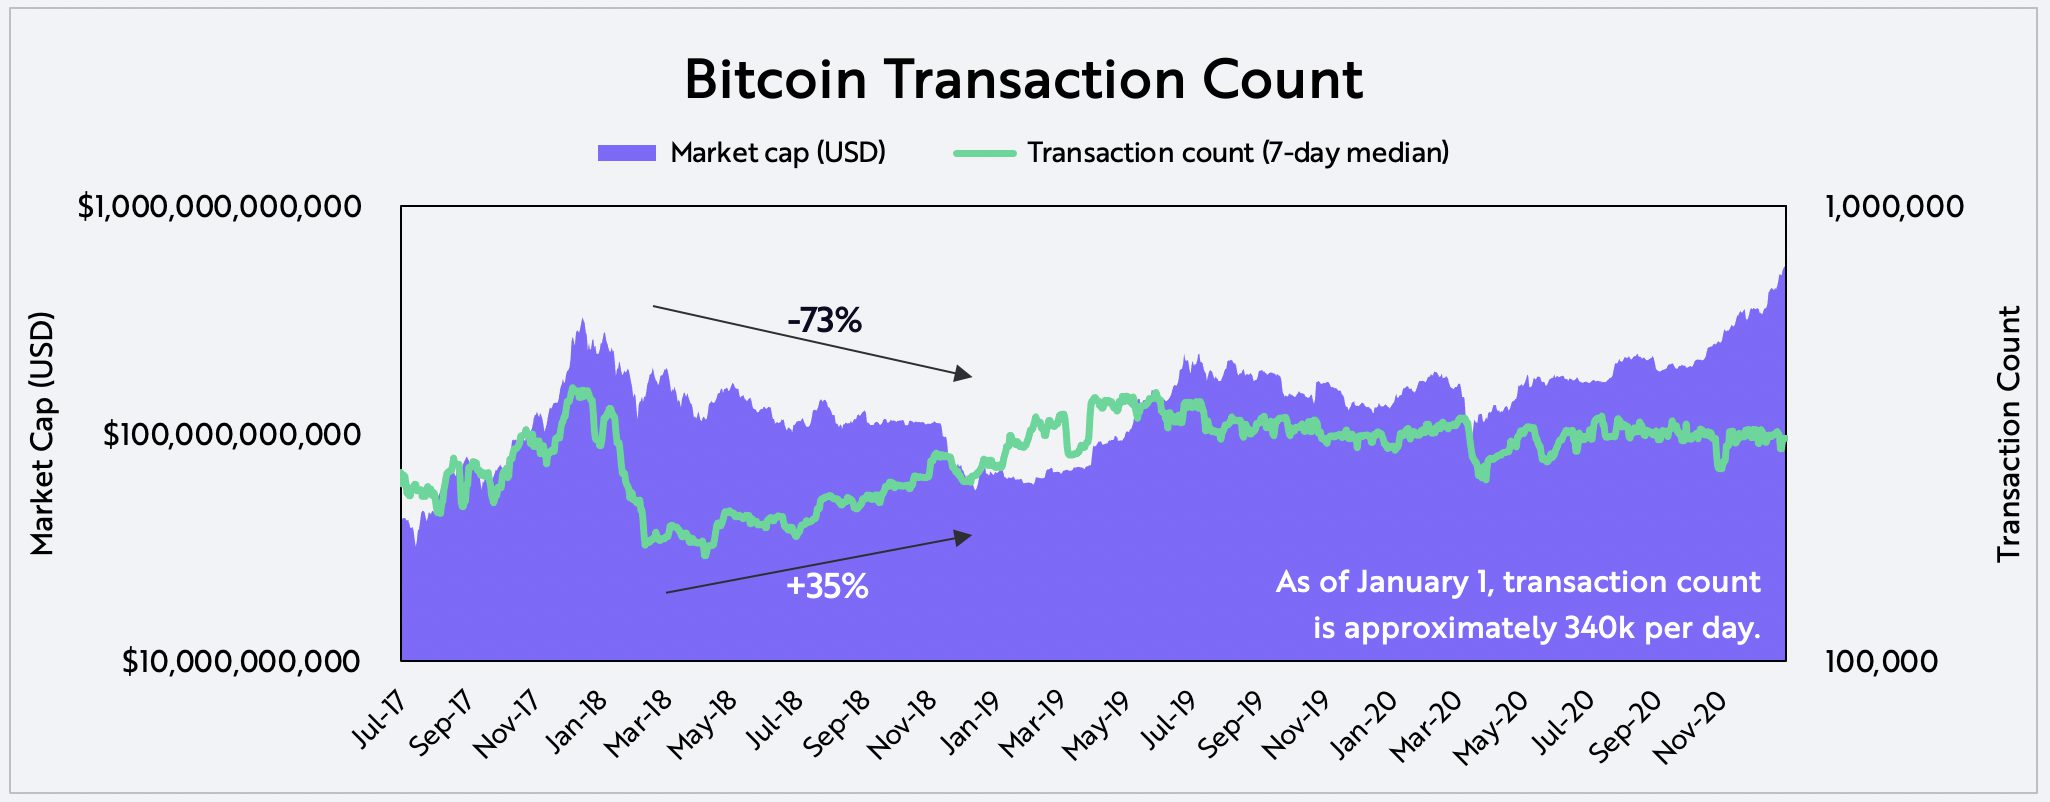
Transaction count is a good proxy of economic activity but is not correlated highly with price in shorter term periods. Bitcoin has facilitated more than 600 million transactions in its 12-year history, with robust activity continuing in recent years despite wide swings in the price. During the 2018 bear market, for example, transaction count actually increased roughly 35% as bitcoin’s price dropped by 73%, as shown below, suggesting healthy network activity.
For informational purposes only and should not be considered investment advice, or a recommendation to buy, sell or hold any particular security or cryptocurrency.
Source: ARK Investment Management LLC, Glassnode
Now that we have described the health of the Bitcoin network, in Part 2 of this series we will analyze the second data layer of the pyramid, including flows into and out of bitcoin, the behavior of holders, and the cost bases of various cohorts.
This article is in collaboration with Glassnode (@glassnode). Glassnode is a blockchain data and intelligence provider that generates innovative on-chain metrics and tools for digital asset stakeholders.
To learn more, we invite you to download ARK’s two-part Bitcoin white paper: Bitcoin: A Novel Economic Institution and Bitcoin As An Investment.
Related Research


Centralization Drives Need for Bitcoin Network Changes