Actively Managed Equity
 Overview: All Strategies
 Investor Resources
 Indexed Equity
 Private Equity
 Digital Assets
 Invest In The Future Today
 Take Advantage Of Market Inefficiencies
 Make The World A Better Place
 Articles
 Podcasts
 White Papers
 Newsletters
 Videos
 Big Ideas 2024
The Model 3 Is Cheaper to Own Than a Toyota Camry

The long-range Model 3’s sticker price is $44,500, roughly 85% higher than that of a Toyota Camry; yet, ARK’s research shows that the Model 3 could be the better deal over a three-year period.
Early this year, Kelley Blue Book (KBB) published its Best Resale Value Awards for 2019. According to KBB, over a three-year period the Tesla Model 3 is likely to retain 69.3% of its original sales price, 20+ percentage points or 37% more than the Toyota Camry, which will retain 48.6%.
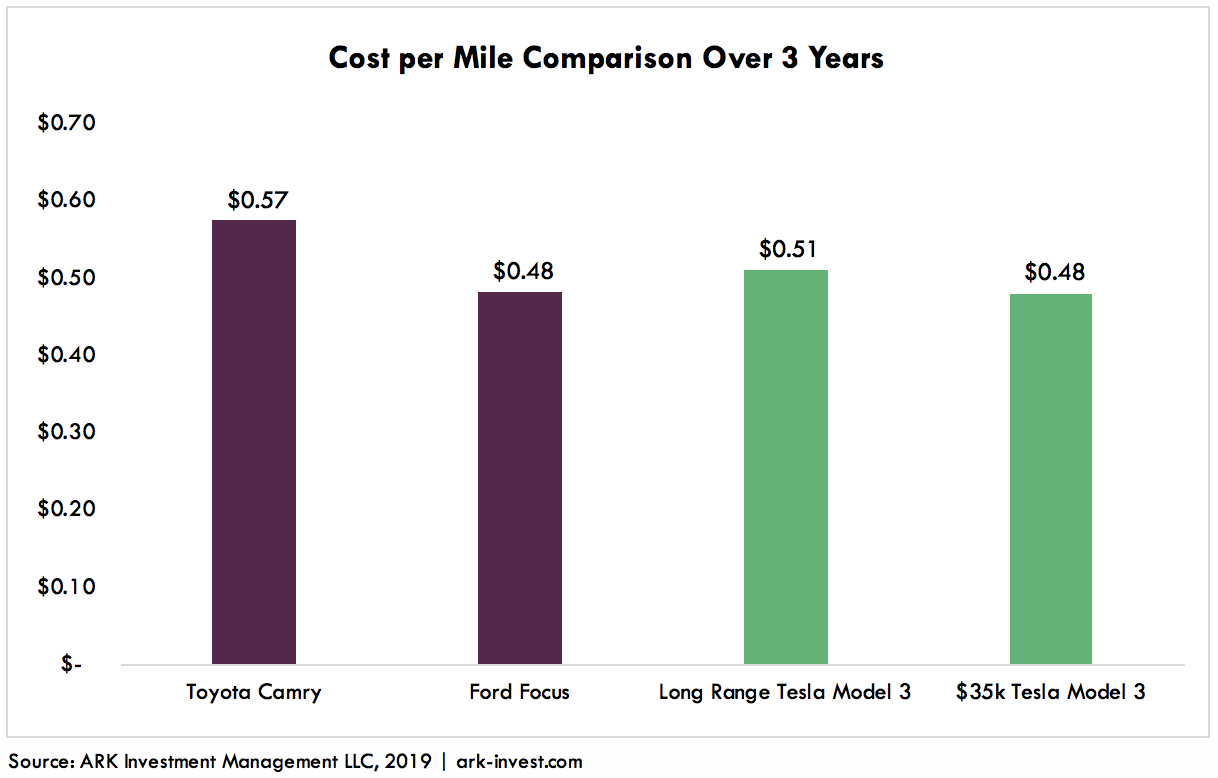
Total Cost of Ownership (TCO) – incorporating maintenance, fueling/charging costs, and the federal tax credit into the comparison – also gives the edge to the Model 3. Our model suggests that the TCO of a Toyota Camry will be 12% higher than that of the mid-range Model 3 over a three-year period, as shown below: $0.57 per mile for the Toyota Camry and $0.51 for the Model 3. Moreover, the gap should widen over time, as Tesla plans to lower the price of the Model 3 to $35,000, while the Camry’s price is likely to remain at or above its current level.
While consumers typically compare monthly payment plans when shopping for cars, recent evidence suggests that TCO is beginning to impact their buying decisions. In January, the CEO of Toyota North America noted that Tesla’s sales explain roughly half of Toyota’s 9% share loss to other brands in the US. TCO also provides a good framework to assess the addressable market for the Model 3, the building blocks of which we offer below.
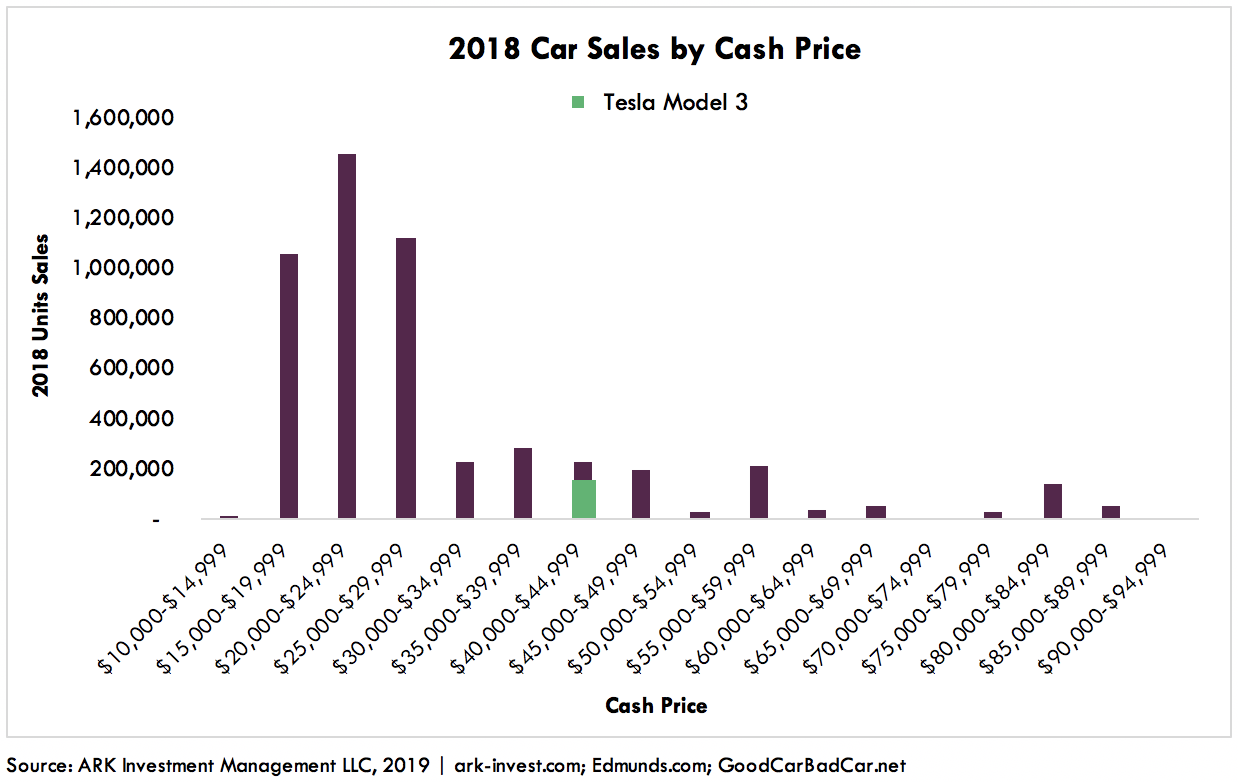
As a starting point, Edmunds calculates the “Cash Price” for vehicles, which includes commonly equipped options and taxes less any widely available rebate. In 2018, based on unit sales broken out by cash price, the Model 3 accounted for 15% of the vehicles at its price point or higher, as shown below. That said, most sales take place at lower price points, explaining why Tesla cut costs so it can produce a Model 3 for $35,000 profitably.
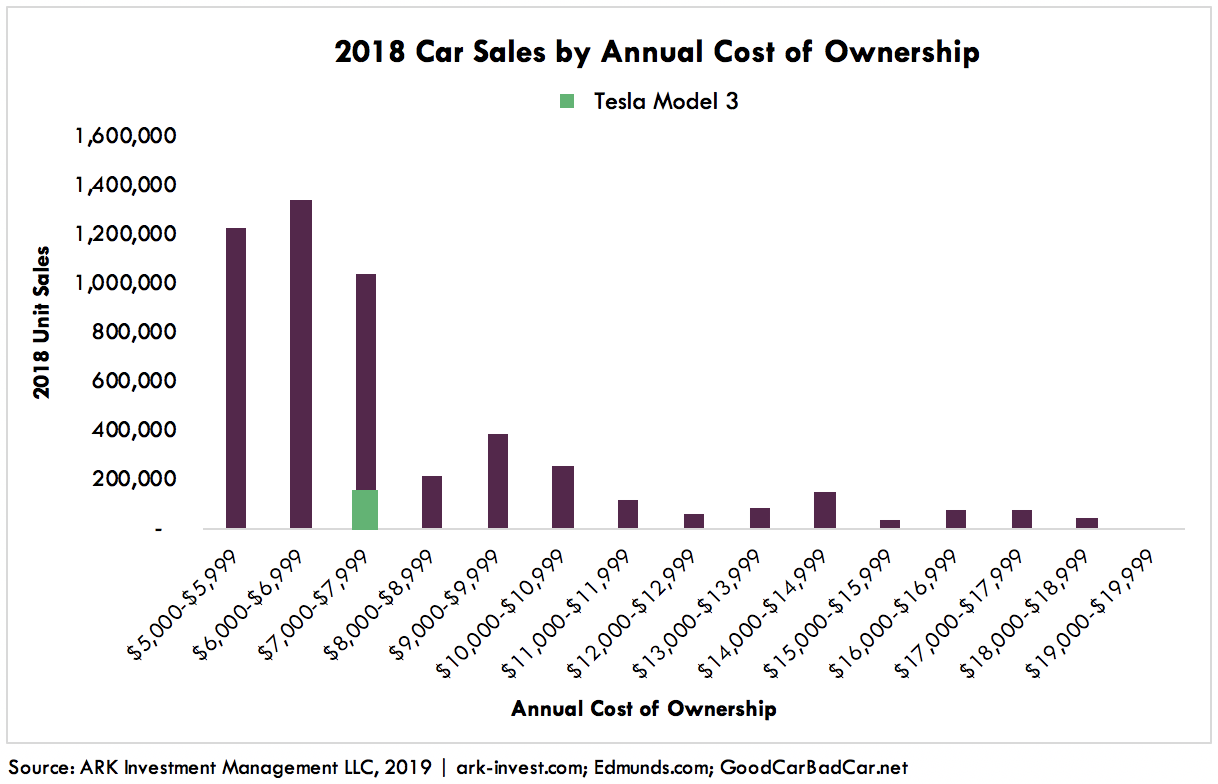
The high number of Toyota and other trade-ins at low prices suggests that “cash price” could be the wrong way to frame potential demand. Our analysis for the cost per year of owning various cars is illuminating. On that basis, the long-range Model 3 already fits into the “mass market” segment, as shown below, suggesting that Tesla still has plenty of room to grow market share. Also worth noting, Tesla does not advertise and still is prohibited from selling cars in 17 states.
Important to note, while this analysis is focused on cars in the U.S., the Model 3 is going global. In addition, the U.S. market skews towards SUVs and light duty trucks which are not included in this analysis.
ARK believes in open source research, so here is the model of our total cost of ownership.[1] Feel free to experiment with it and share any thoughts or questions with us.
Related Research


Range Anxiety: Is It Too Soon to Buy a Tesla?