Actively Managed Equity
 Overview: All Strategies
 Investor Resources
 Indexed Equity
 Private Equity
 Digital Assets
 Invest In The Future Today
 Take Advantage Of Market Inefficiencies
 Make The World A Better Place
 Articles
 Podcasts
 White Papers
 Newsletters
 Videos
 Big Ideas 2024
Buyer and Seller Behavior: Analyzing Bitcoin's Fundamentals


This article was co-authored by David Puell (@kenoshaking). David is a full-time cryptocurrency on-chain analyst and market researcher. Best known for pioneering the emergent field of on-chain analysis, David has created original Bitcoin valuation metrics, including the MVRV Ratio and the Puell Multiple.
In this series, we introduce a framework to analyze bitcoin’s fundamentals in more depth than we believe is usually possible for any traditional asset. We characterize the depth with a three-layered pyramid, the lower layers serving as building blocks for the higher layers, as shown below.
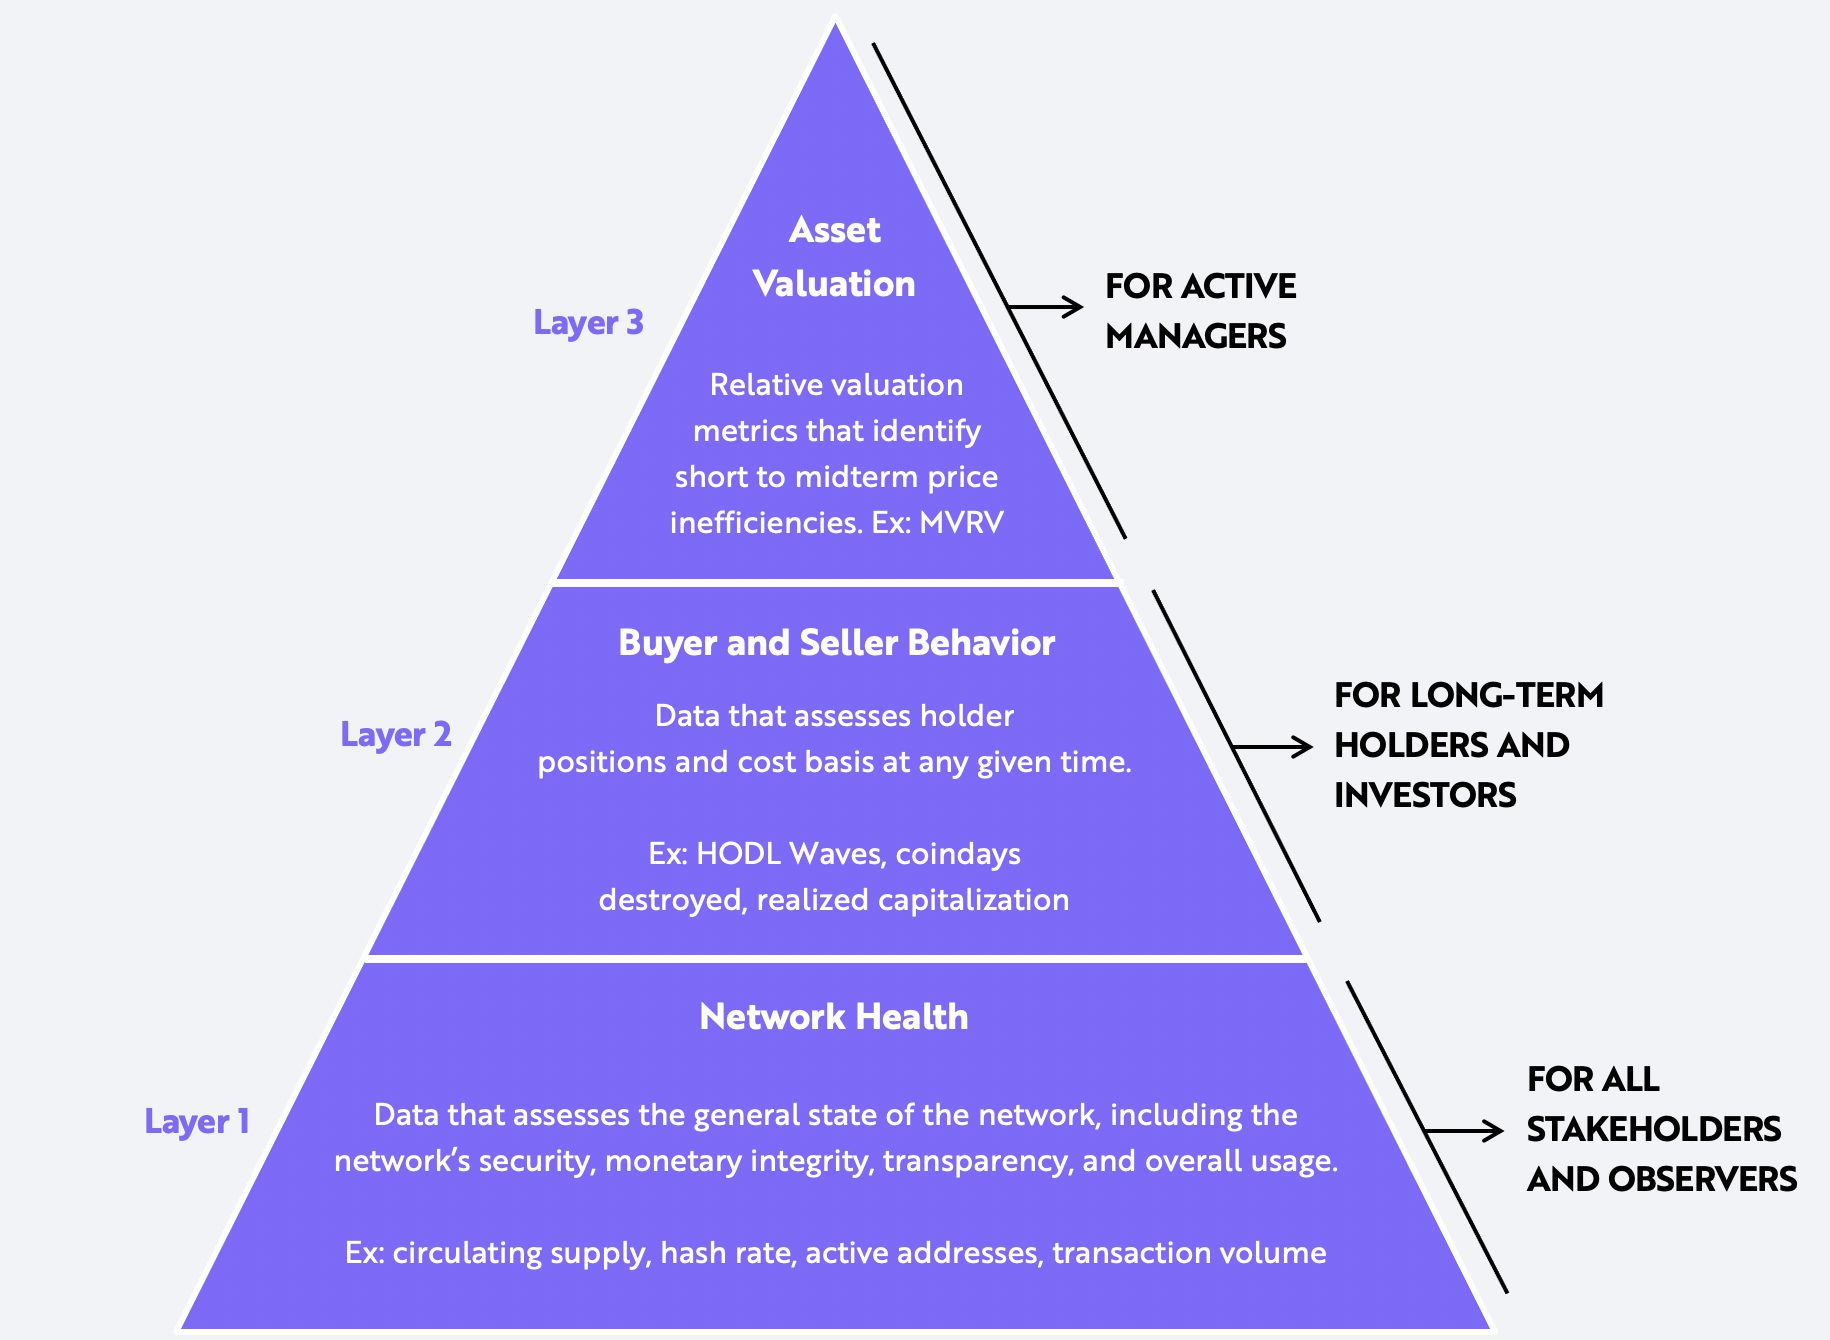
Note: The Market Value to Realized Value (MVRV) ratio is a long-term metric used to assess bitcoin’s market cycles over the long term. HODL is a term derived from a misspelling of “hold” that refers to buy-and-hold strategies in the context of bitcoin and other cryptocurrencies.
Source: ARK Investment Management LLC, 2020
In Part 1, we detailed the data in the bottom layer of the pyramid, which assesses the health of Bitcoin’s network. In Part 2, we will focus on the data in the middle layer, assessing bitcoin holders’ positions and cost bases at any point in time.
The value of a monetary asset like bitcoin is a function of demand relative to supply. While the supply of bitcoin is mathematically metered, its demand is a function of the monetary characteristics enabling it to play the unique role of a global digital money. Since its inception more than 12 years ago, the demand for bitcoin has trended upwards[1] but, over shorter time periods, it has fluctuated dramatically. Based on on-chain data, investors can assess the variability of demand, and its likely impact on price, by analyzing the behavior of bitcoin buyers and sellers at any point in time.
On-Chain Analysis: A Look into Bitcoin’s Inner Economics
Investors can leverage Bitcoin’s on-chain data to assess the economic behavior—including inflows, outflows, holding patterns, and cost bases—of all market participants. It tracks each participant on-chain using simple address-based heuristics. Here we define these participants and their roles in the Bitcoin “economy” and then depict them in the graph below.
- Miners and Mining Pools: Miners are responsible for issuing new bitcoin. Funding their operations with mined bitcoin, they are the only natural sellers involved in the network. The selling pressure associated with miners is proportional to the rate of newly issued bitcoin.
- Exchanges: Exchanges are responsible for bitcoin’s price discovery. Passing through exchange addresses are on-chain flows from most market participants including miners, OTC desks, custodians, and holders/investors.
- Holders, Investors, and Users: Holders, investors, and users round out bitcoin’s economy. On-chain data measures the rate at which financial institutions, individuals, and merchants adopt and the periods during which they hold bitcoin.
Based on the economic flows and interactions between and among these market participants, we can assess bitcoin’s value.
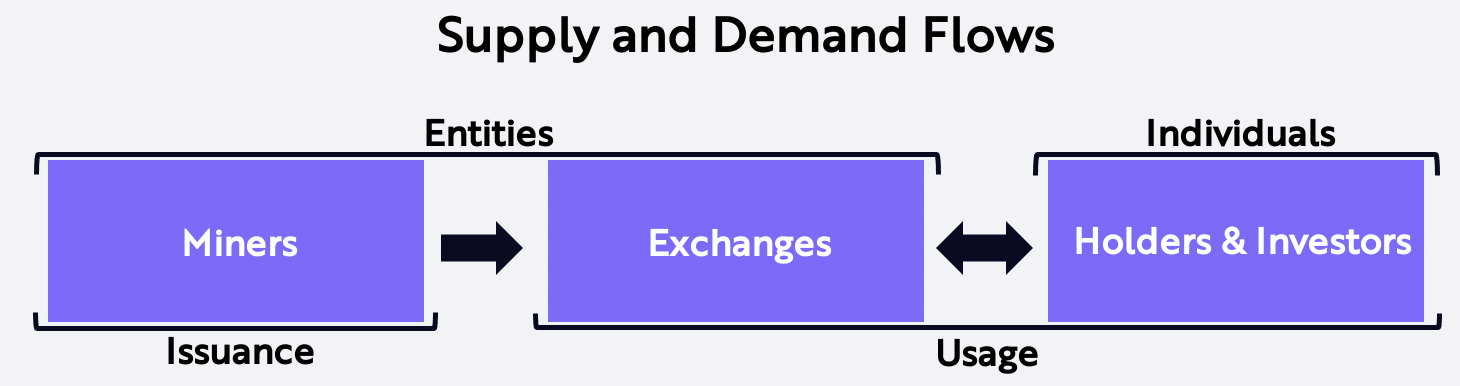
Source: ARK Investment Management LLC, 2020
UTXOs: Bitcoin’s Transaction Ledger
Bitcoin’s on-chain data details the behavior of participants with a simple and transparent accounting system: the unspent transaction output, or UTXO for short. UTXOs record the number of bitcoins in each address at the time of every transaction. If Miner Bob, for example, earns two bitcoins for validating a block of transactions and sells one of them to Investor Alice, both Bob’s and Alice’s UTXOs record the addition of one bitcoin after the transaction. If participants run full nodes, they can track and verify all bitcoin UTXOs.
Most important, UTXOs allow investors to track two data points in every address on the Bitcoin ledger: the number of coins located in each address (volume) and the amount of time the coins have been in each address (time). If the same system governed the equity markets, anyone interested could track the ownership of company shares by quantity, holding period, and purchase/sale prices.
The Building Blocks of On-Chain Analysis
We believe the on-chain behavior of buyers and sellers can help investors identify bitcoin price inefficiencies. As described in the next section, several metrics can monitor the behavior of buyers and sellers. From these metrics, we can derive relative valuation metrics that identify short- to mid-term inefficiencies in bitcoin’s price.
I. Cointime Destroyed
First conceptualized by the pseudonym ByteCoin on the Bitcointalk.org forum in 2011.
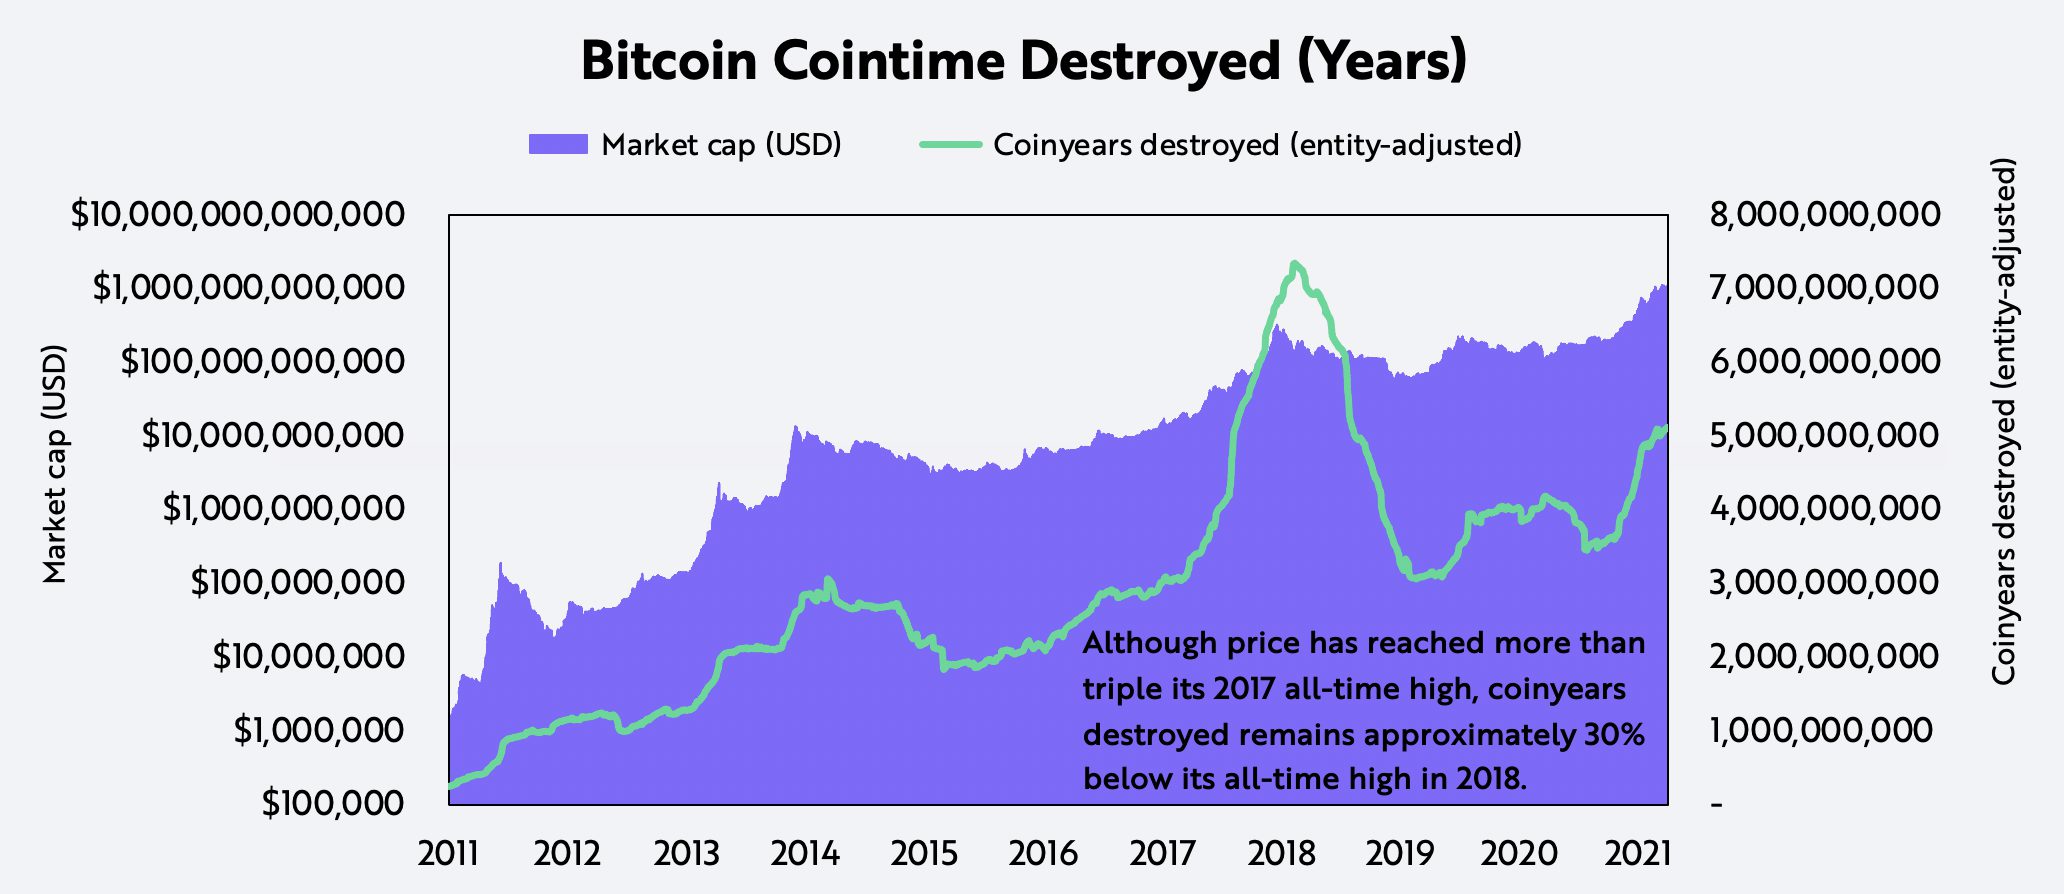
Cointime destroyed, widely presented as coindays destroyed, measures the time-weighted turnover of bitcoin: the number of bitcoins transacted within a given period (volume) and the time held before transacting (holding period). If two bitcoins had not moved in seven days but then engaged in a transaction, 14 coindays would have been destroyed. An increase in cointime destroyed implies that holders are moving coins out of long-term storage and taking profits. At slightly above 5 billion today, coinyears destroyed, the rolling sum of coindays destroyed during the last 365 days, we believe depicts a healthy bull market, as shown below: bitcoin’s price has hit more than triple its 2017 all-time high, and yet coinyears destroyed still is below the all-time high hit in early 2018.
For informational purposes only and should not be considered investment advice, or a recommendation to buy, sell or hold any particular security or cryptocurrency.
Source: ARK Investment Management LLC, Glassnode
II. On-Chain Profits and Losses
First conceptualized by Glassnode in 2019.
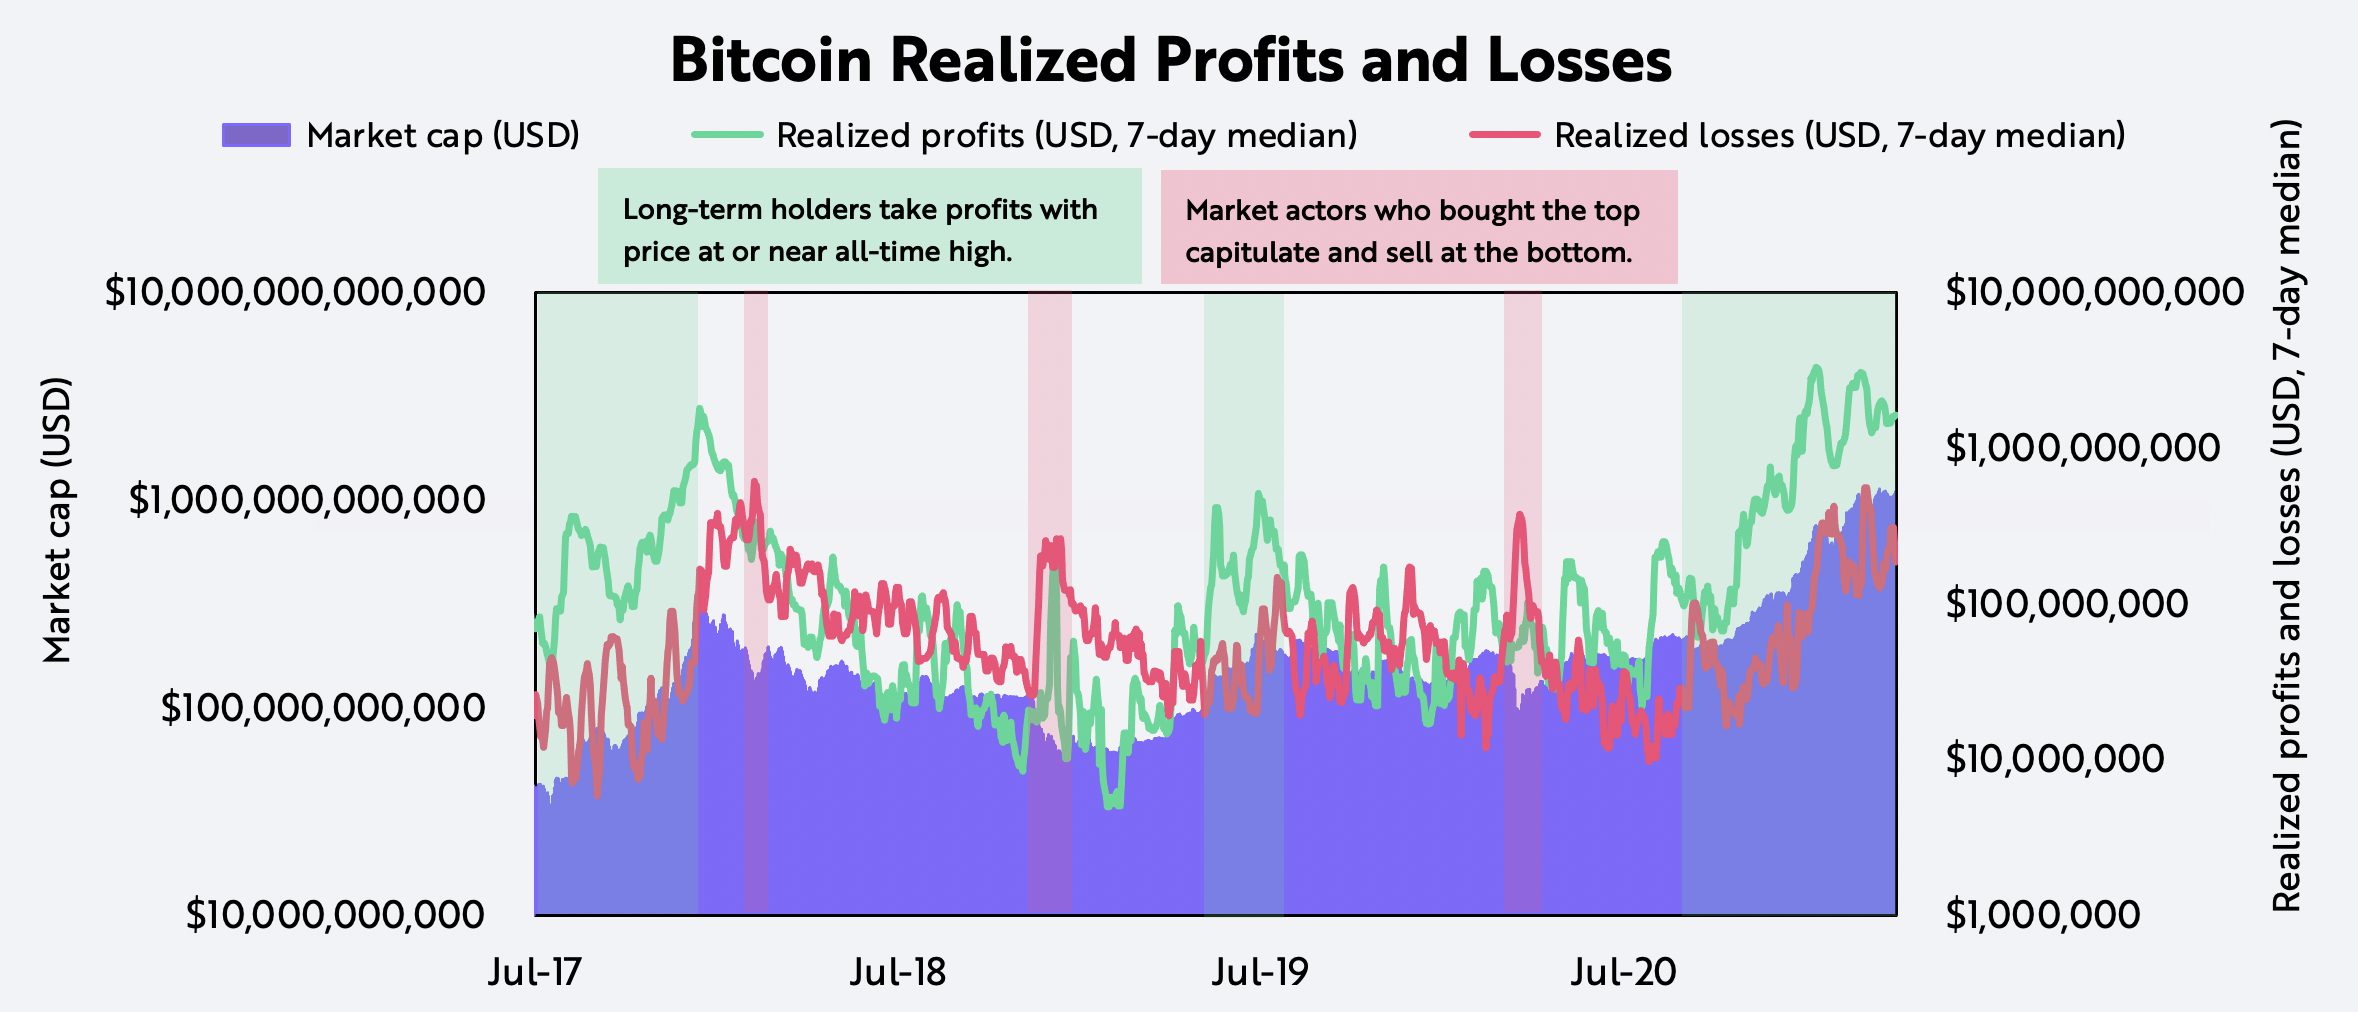
Realized profits /losses measures the total USD value of bitcoins that are transacting at a profit or a loss. If a bitcoin transacts at a higher or lower price than the price at which it last moved, its subsequent move creates a profit or a loss, respectively. Periods of extreme volatility maximize profits and losses at market tops and bottoms, respectively, as shown below.
For informational purposes only and should not be considered investment advice, or a recommendation to buy, sell or hold any particular security or cryptocurrency.
Source: ARK Investment Management LLC, Glassnode
Supply in profit /loss measures the number of outstanding bitcoins with a profit or loss relative to their last transaction. Today, the supply of bitcoin in profit is almost at an all-time high and supply in loss is at lows not seen since late 2017. In addition, whenever the number of bitcoins in loss has equaled or surpassed the number of bitcoins in profit, data suggests that prices have been in a bottoming process, as shown below.
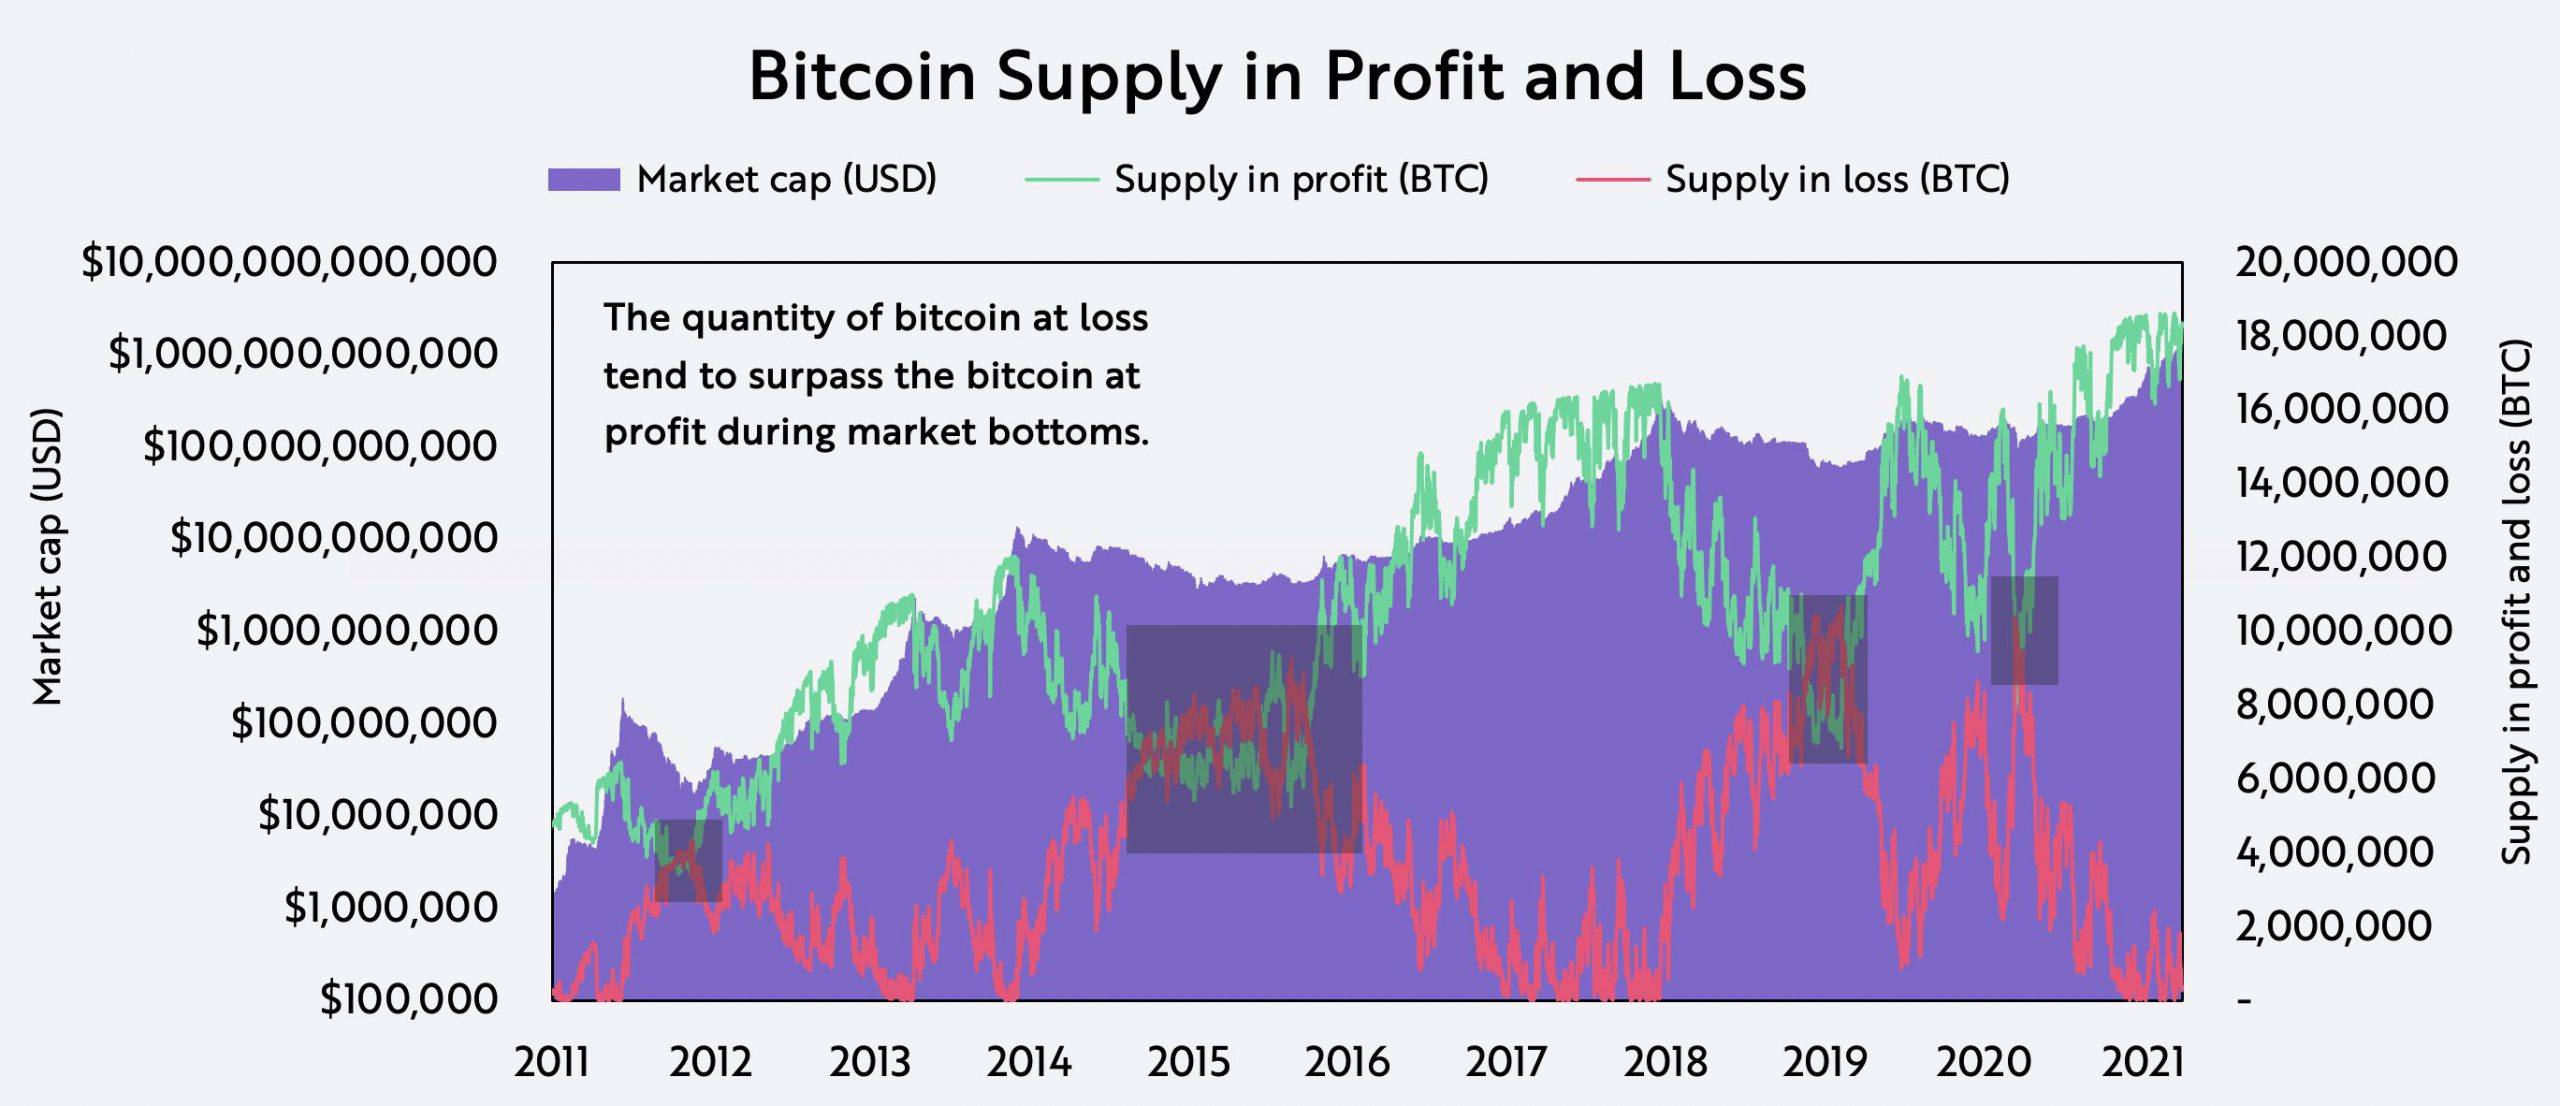
For informational purposes only and should not be considered investment advice, or a recommendation to buy, sell or hold any particular security or cryptocurrency.
Source: ARK Investment Management LLC, Glassnode
III. Realized Capitalization
First conceptualized by Nic Carter and Antoine Le Calvez in 2018.
While market capitalization (market cap) aggregates the value of all bitcoins in circulation at current prices, realized capitalization (realized cap) is their average cost basis, valuing each bitcoin at the price of its last move. Whenever market cap drops below realized cap, the overall bitcoin market sells at a loss, denoting capitulation. Today, bitcoin’s market cap is roughly $1 trillion, nearly three times its roughly $350 billion in realized cap.
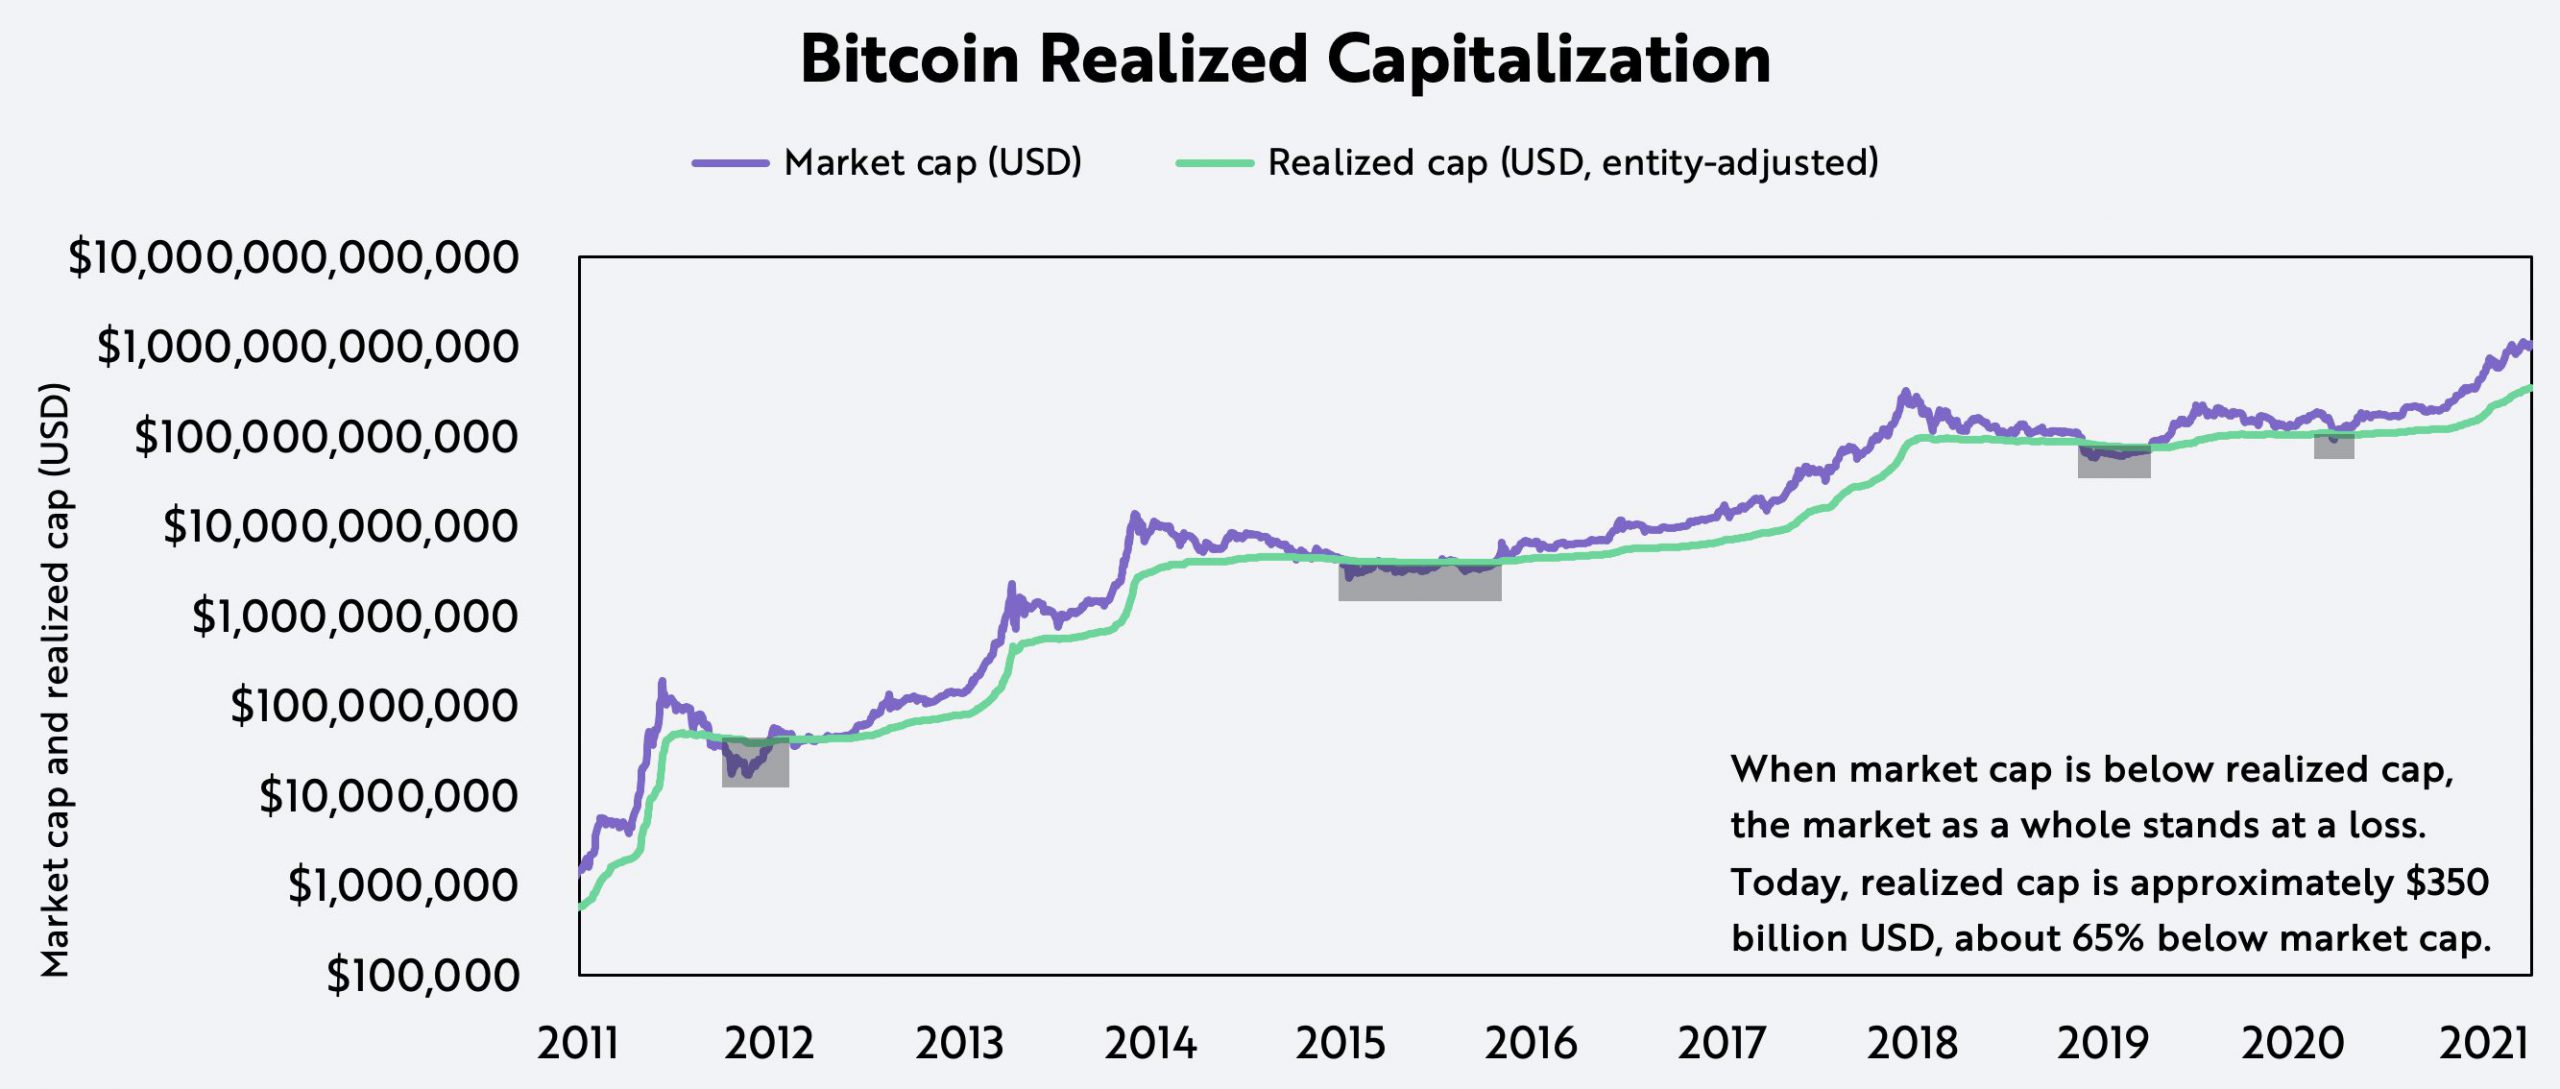
For informational purposes only and should not be considered investment advice, or a recommendation to buy, sell or hold any particular security or cryptocurrency.
Source: ARK Investment Management LLC, Glassnode
IV. Thermo Capitalization
First conceptualized by Nic Carter in 2018.
Thermo capitalization is the total USD value of coins paid to miners for validating transactions and securing the Bitcoin network. Like bitcoin’s market cap during the past 12 years, thermo capitalization has increased, albeit at a decreasing rate thanks to the logarithmic increase in bitcoin’s supply. As of April 1, thermo capitalization is roughly $23 billion, nearly 98% below bitcoin’s market cap and 93.5% below its realized cap, illustrating that miners no longer dominate as natural sellers. Thermo capitalization, therefore, does not offer clear signals of buying and selling behavior but, as we will explore in Part 3, can be an important measure of valuation.
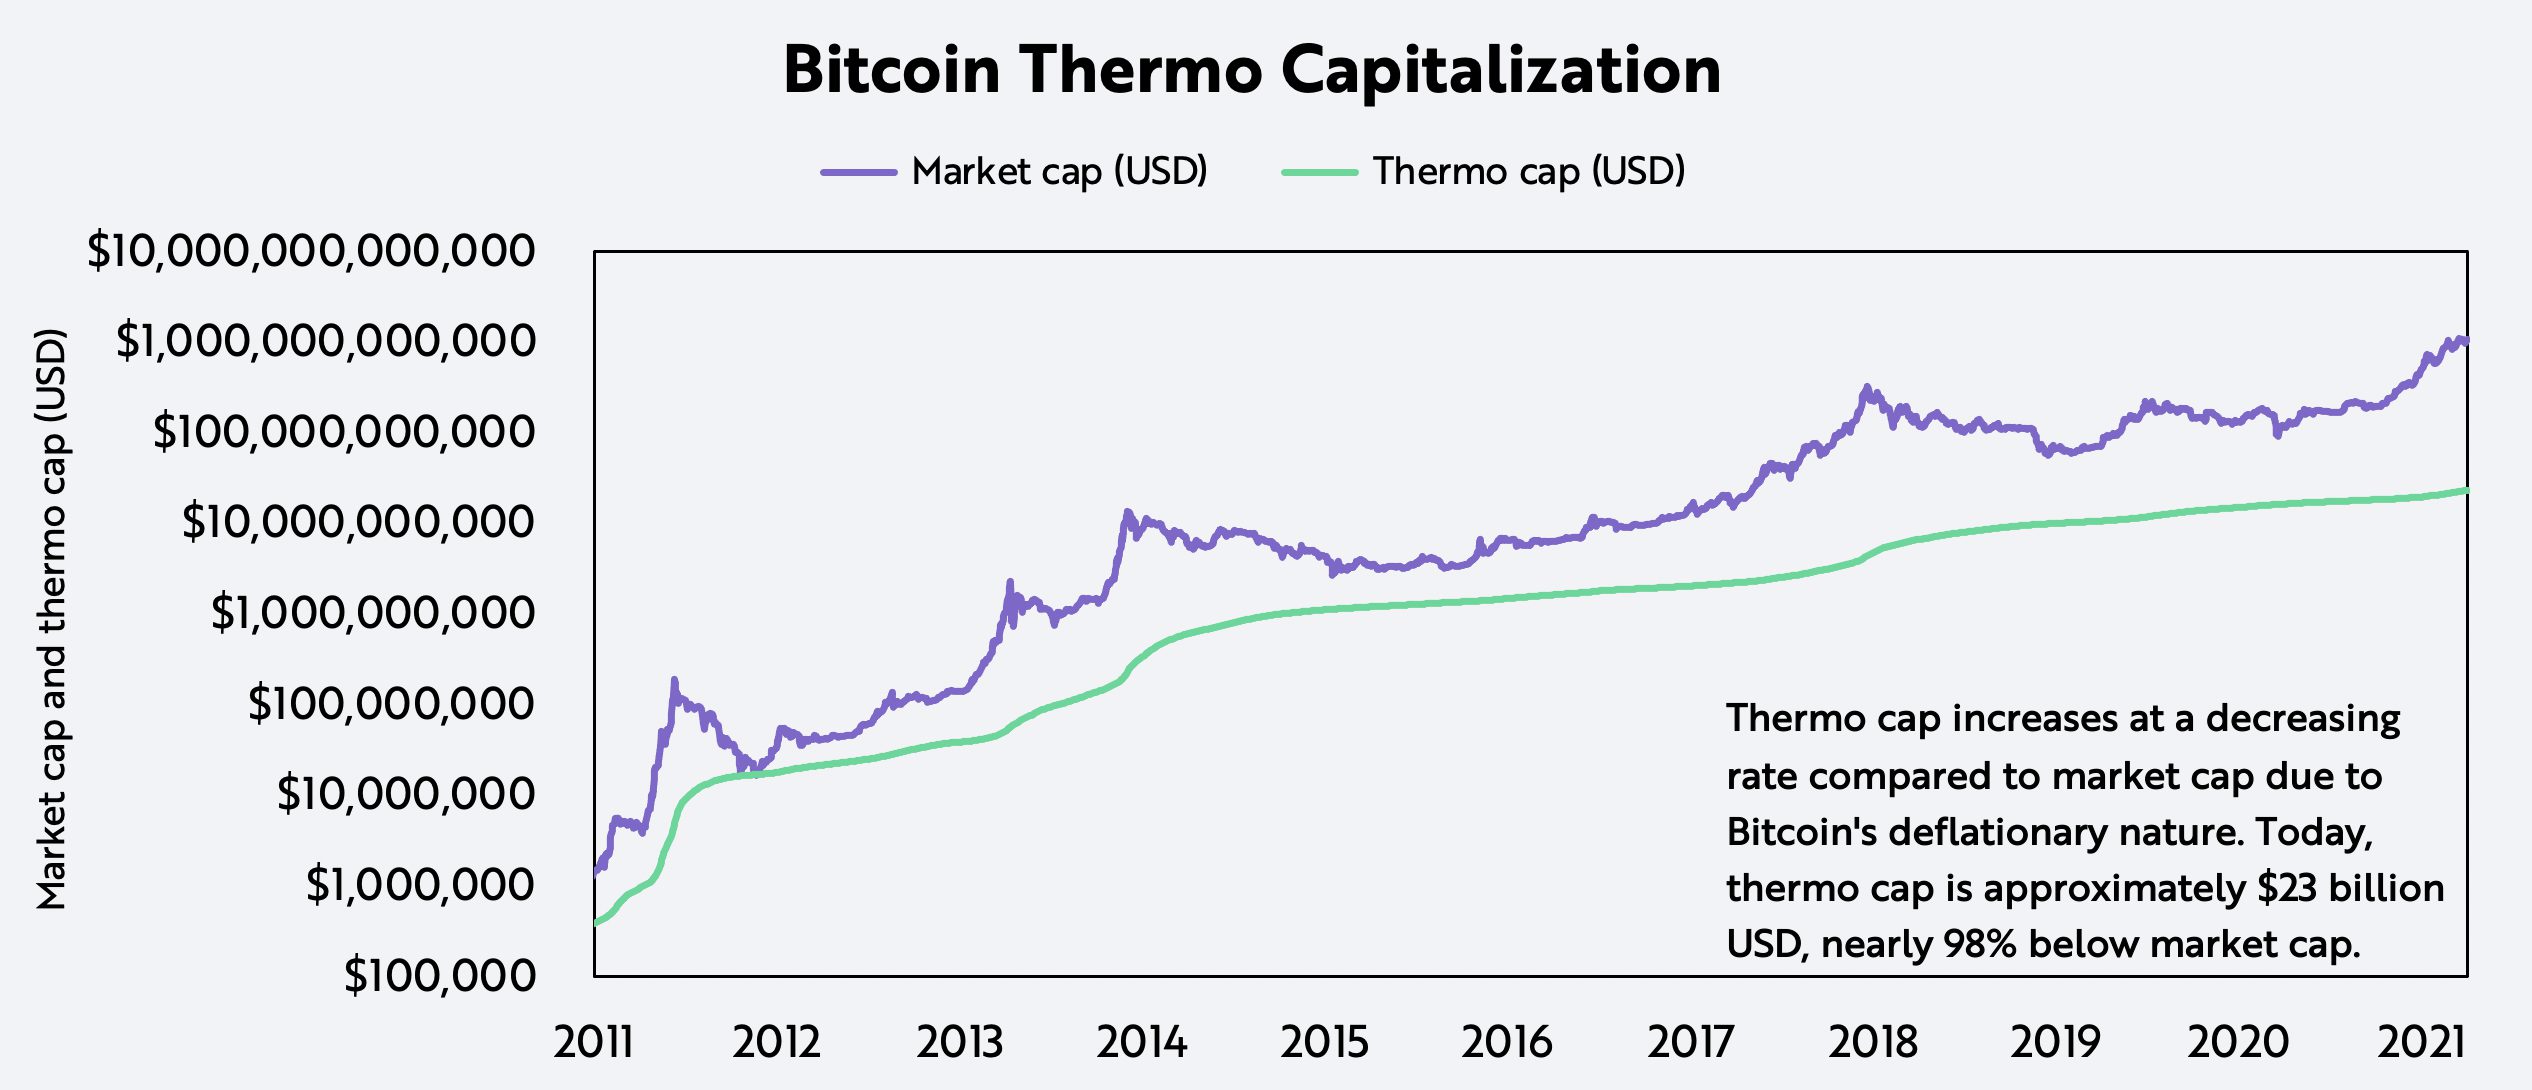
For informational purposes only and should not be considered investment advice, or a recommendation to buy, sell or hold any particular security or cryptocurrency.
Source: ARK Investment Management LLC, Glassnode
V. HODL Waves
First conceptualized by Dhruv Bansal in 2018.
“HODL” waves, named after the bitcoin early-adopter parody word for “hold”, divides the total circulating supply of the Bitcoin network into holding period bands. The 1-week HODL wave, for example, measures the percentage of bitcoin that transacted during the last week, the 1-to-2-year HODL wave measures the percentage of bitcoin that transacted between one and two years ago, and so on. While typically it features 12 waves, the simplified chart below illustrates that short-term holding period bands rise dramatically during phases of market exuberance and longer-term bands rise during major market downturns. Today, roughly 55% of bitcoin’s supply hasn’t moved in more than a year, we believe illustrating investors’ longer-term conviction and focus.
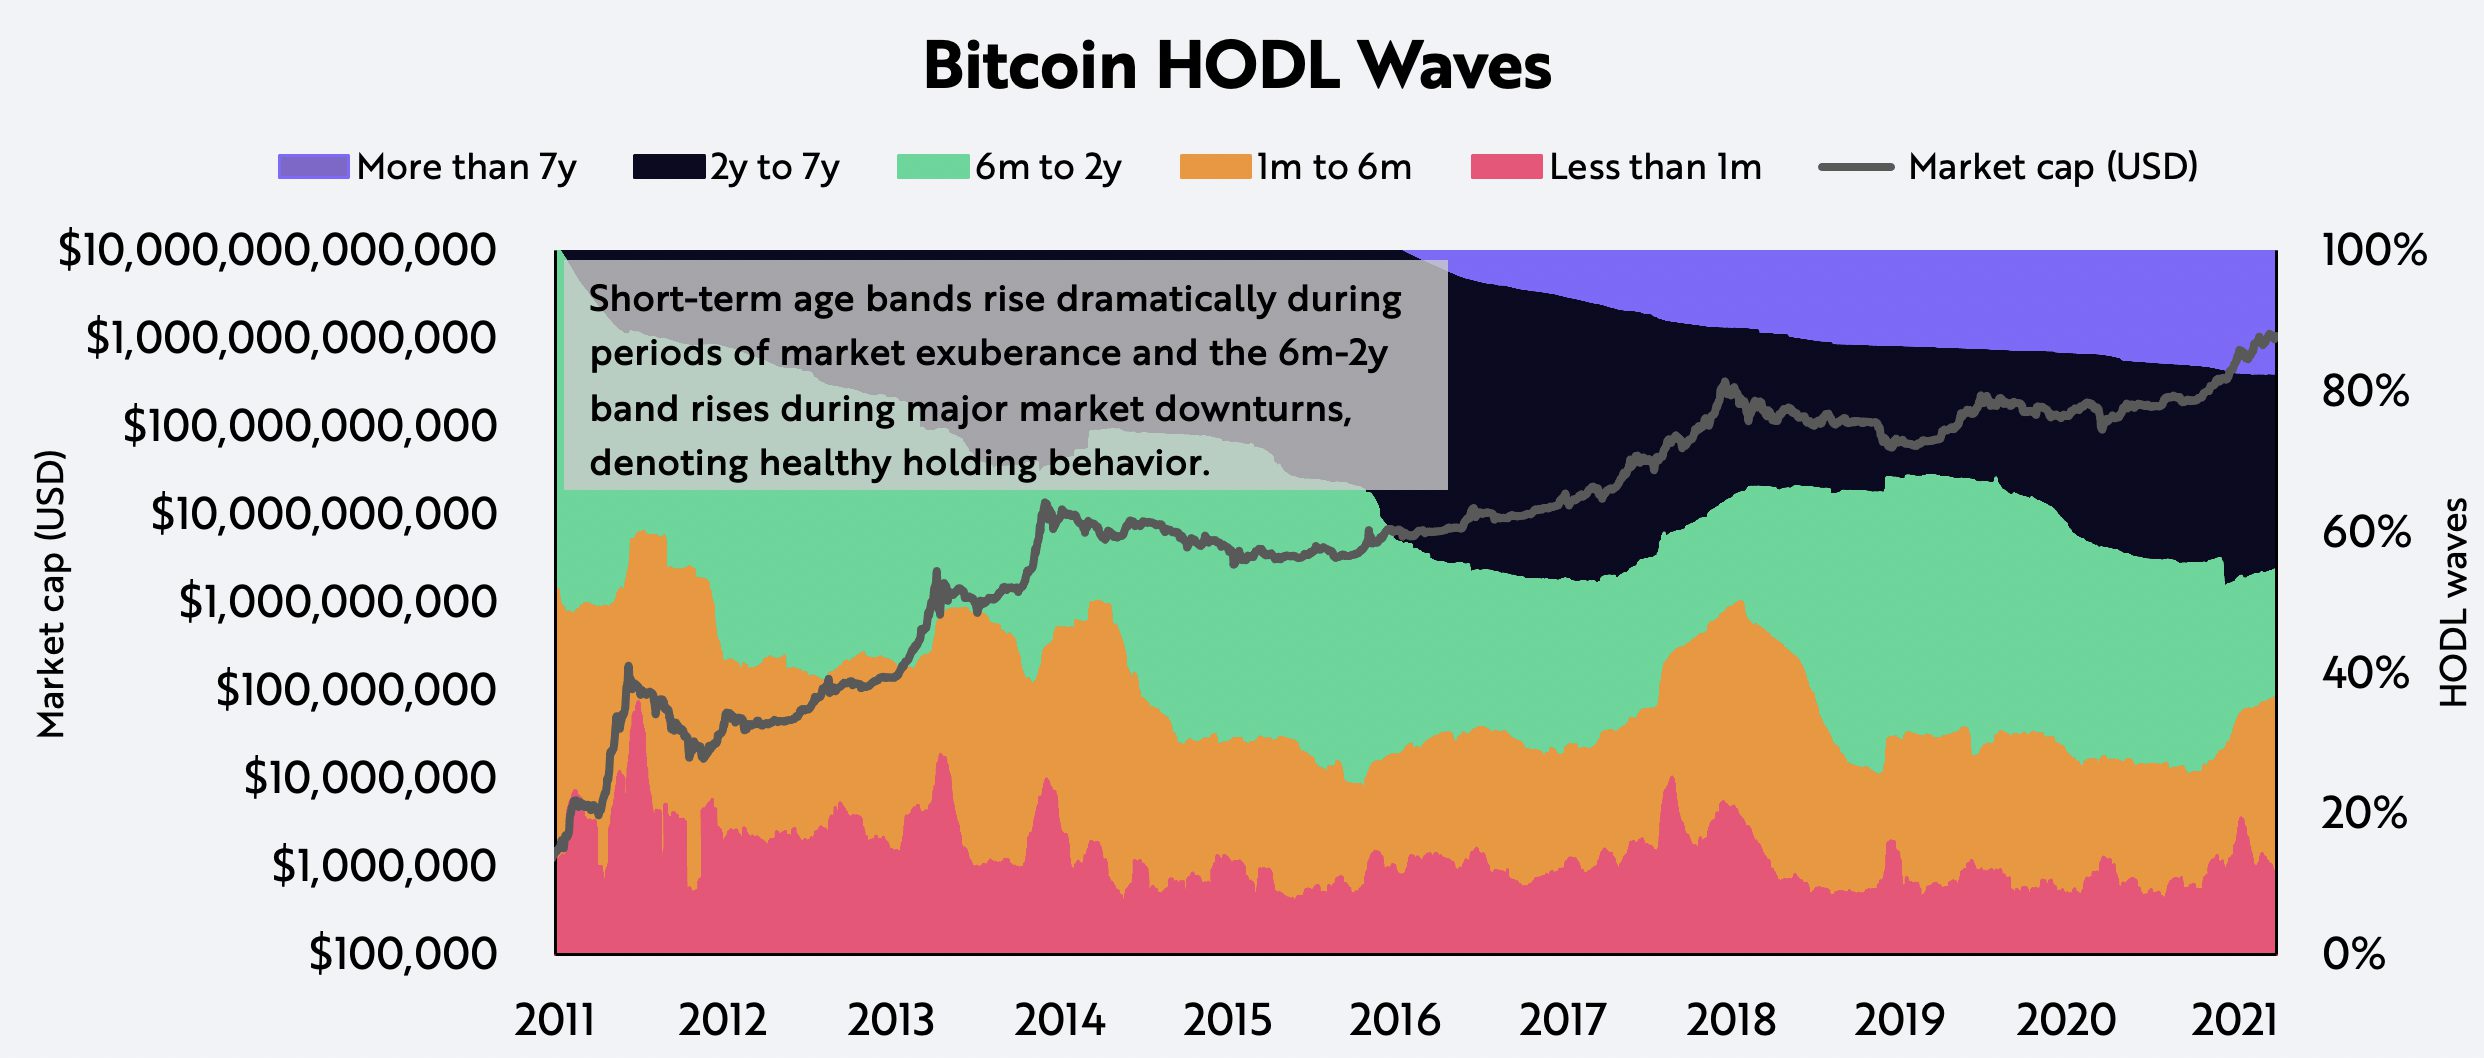
For informational purposes only and should not be considered investment advice, or a recommendation to buy, sell or hold any particular security or cryptocurrency.
Source: ARK Investment Management LLC, Glassnode
Based on these metrics assessing the buying and selling of bitcoin, in Part 3 of this series we will analyze the third data layer of the pyramid and offer relative valuation metrics which help identify inefficiencies in bitcoin’s price.
This article is in collaboration with Glassnode (@glassnode). Glassnode is a blockchain data and intelligence provider that generates innovative on-chain metrics and tools for digital asset stakeholders.
To learn more, we invite you to download ARK’s two-part Bitcoin white paper: Bitcoin: A Novel Economic Institution and Bitcoin As An Investment.
Related Research


Centralization Drives Need for Bitcoin Network Changes